Timing Value vs. Growth: Evidence from 100 Years of Small Value–Large Growth Spread
The goal of our article is to examine the long-term relationship between small value and large growth stocks using more than 100 years of data and test whether the spread between small value and large growth portfolios shows trends that could help investors switch between the two styles. Using the Fama and French 2×3 and 5×5 size and book-to-market portfolios, we construct the small value minus large growth (SV–LG) spread and apply simple trend-following signals based on moving averages and momentum with horizons ranging from 3 to 12 months. Our results show that trend-following strategies are able to capture part of the value outperformance on the long side. Timing periods when growth stocks dominate is much more difficult.
Introduction
Value investing, introduced by Graham and Dodd (1934), is based on the idea that stock prices can deviate from their intrinsic value and that investors can benefit by buying undervalued companies. A large body of academic research later confirmed that stocks with high book-to-market ratios (value stocks) tend to earn higher average returns than low book-to-market stocks (growth stocks).
However, financial markets periodically experience long periods in which growth stocks strongly outperform value stocks, often during technological booms. The recent dominance of large technology firms, often referred to as the “Magnificent Seven,” is a recent example. While history suggests that such periods are temporary, it remains unclear whether investors can systematically time the rotation between value and growth strategies. This paper examines this question using more than 100 years of data. Our results suggest that a long-only strategy on the small value minus large growth spread is the most robust approach, and given the more than 20-year period of growth dominance, it may only be a matter of time before small value stocks begin to outperform large growth stocks again.
The remainder of the paper is organized as follows. Section Data describes the data and methodology used in the analysis. Section Results presents the empirical results for the 2×3 and 5×5 portfolio constructions. Section ETF compares the results with ETF-based proxies for value and growth strategies. Section Conclusion concludes.
Theoretical Background
The relative performance of value and growth stocks has been one of the central topics in asset pricing and investment research for nearly a century. The origins of value investing can be traced to Graham and Dodd (1934), who argued that stock prices may deviate from their intrinsic value and that investors could exploit such mispricing by purchasing undervalued securities. Over time, market prices should converge toward intrinsic values, allowing patient investors to earn superior long-term returns.
This philosophy later became known as value investing and has influenced generations of investors, including Warren Buffett. In his well-known essay The Superinvestors of Graham-and-Doddsville (1984), Buffett documents the consistent success of several investors trained in the Graham–Dodd tradition and concludes that disciplined value investing can exploit systematic market mispricing.
Academic research has provided support for this idea. A large body of literature documents that firms with high book-to-market ratios (value stocks) tend to earn higher average returns than firms with low book-to-market ratios (growth stocks) (Zhang (2005) and Lakonishok, Shleifer, and Vishny (1994). Fama and French (1992, 1993) show that size and book-to-market ratios explain a significant portion of the cross-sectional variation in stock returns. Their findings suggest that smaller firms and firms with high book-to-market ratios earn systematically higher expected returns. The value premium has then been documented across many international markets (Fama and French, 1998).
Financial markets sometimes go through periods when growth stocks outperform value stocks, often during technological booms such as the recent dominance of the “Magnificent Seven” companies. We examined the potential to systematically exploit technology sector dominance in our recent article, Can Technology Sector Leadership Be Systematically Exploited? However, history shows that these periods are usually temporary and are often followed by a recovery of value stocks. The goal of this paper is to investigate whether the relative performance between small value and large growth stocks exhibits systematic trends that can be exploited using simple timing rules.
Methodology and Data
Our empirical analysis uses the Fama–French portfolio datasets, which provide long-term historical returns (starting in 1926) for portfolios sorted on size and book-to-market ratios. We begin with traditional 2×3 portfolio construction, which forms six portfolios based on two size groups and three book-to-market groups. Table 1 illustrates how portfolios are constructed from 2×3 Fama-French data.
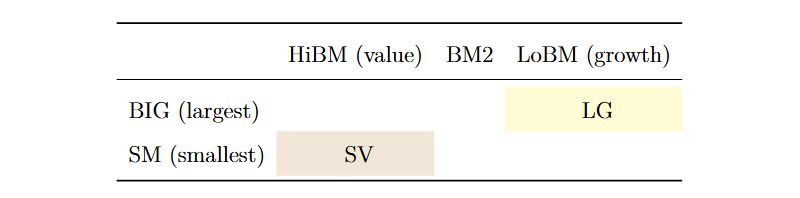
Table 1. Construction of the Small Value (SV) and Large Growth (LG) portfolios from
the Fama–French 2×3 size and book-to-market portfolios
However, the standard 2×3 construction has an important practical limitation. The “small” category includes the bottom 50% of the market capitalization distribution, which consists largely of micro-cap stocks that are difficult to trade in practice. To address this issue, we extend the analysis using the 25 portfolios (5×5) sorted on size and book-to-market.
In the 5×5 framework, large growth (LG) is defined as the average return of the two portfolios consisting of large-cap stocks (top size quintile) with low book-to-market ratios (growth quintiles). Small value (SV) is defined as the average return of four portfolios consisting of mid-to-small stocks (2nd and 3rd size quintiles) with high book-to-market ratios (value quintiles). Table 2 illustrates how portfolios are constructed from 5×5 Fama-French data.
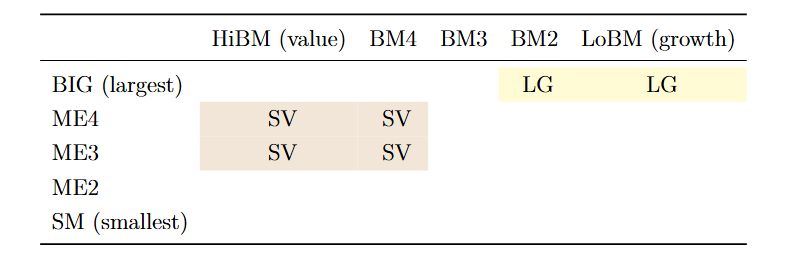
Table 2. Construction of the Small Value (SV) and Large Growth (LG) portfolios from
the Fama–French 5×5 size and book-to-market portfolios
Using monthly data, we construct the spread factor (SV–LG): taking a long position in small value stocks and a short position in large growth stocks. We analyze its long-term performance and then apply simple trend-following signals, including moving averages and momentum indicators with lookback horizons ranging from three to twelve months.
Finally, we compare the historical spreads derived from the Fama–French datasets with ETF-based proxies for value and growth stocks (IWN and IVW).
Results
2×3 Portfolio
First, we calculated the spread between small value (SV) and large growth (LG) portfolios and plotted the equity curve for the last 100 years (Figure 1) and the last 20 years (Figure 2). From Figure 1 we can see that in the long term value outperforms growth; however, this is not the case in the last 20 years.
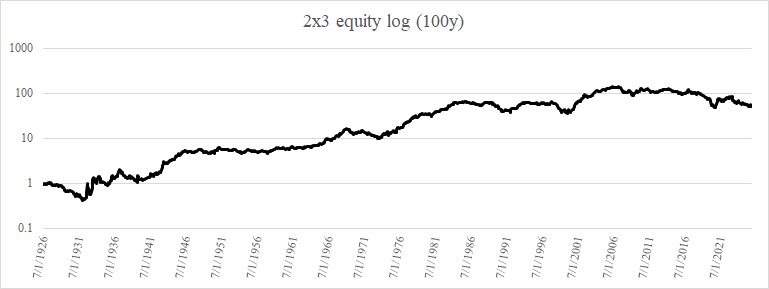
Figure 1. Equity Curve of the Small Value – Large Growth Spread (1926–2025) constructed from the Fama–French 2×3 portfolios over the full sample period
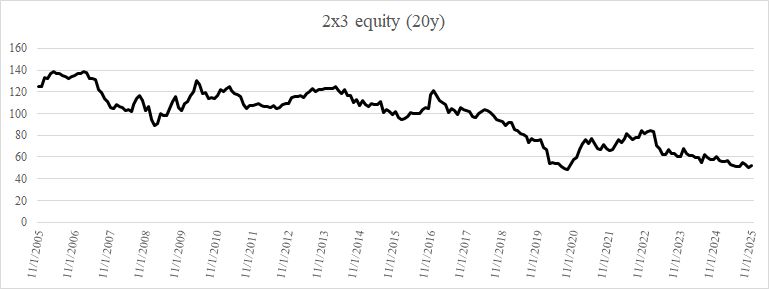
Figure 2. Equity Curve of the Small Value – Large Growth Spread (2005–2025) constructed from the Fama–French 2×3 portfolios over the last 20 years
5×5 Portfolio
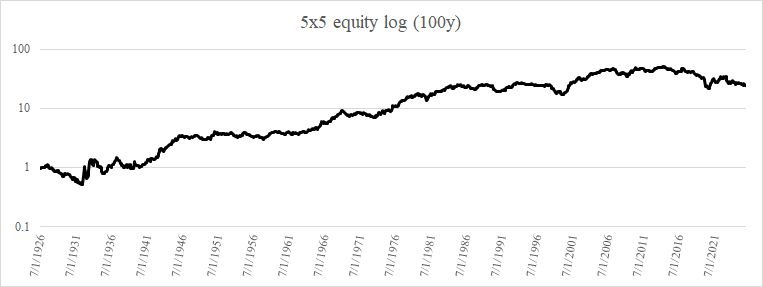
Figure 3. Equity Curve of the Small Value – Large Growth Spread (1926–2025) constructed from the Fama–French 5×5 portfolios over the full sample period
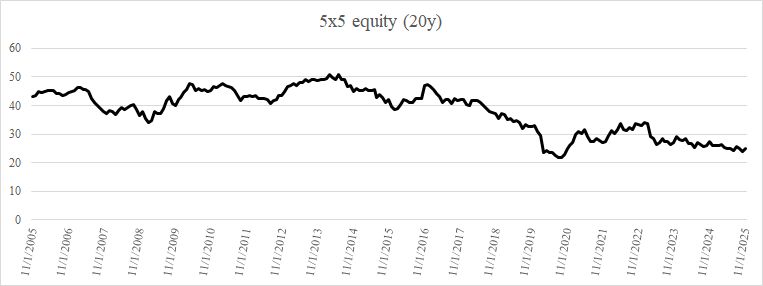
Figure 4. Equity Curve of the Small Value – Large Growth Spread (2005–2025) constructed from the Fama–French 5×5 portfolios over the last 20 years
ETF Comparison
In the next step, we construct an investable proxy for the spread using exchange-traded funds. We use the iShares Russell 2000 Value ETF (IWN) as a proxy for small value stocks and the iShares S&P 500 Growth ETF (IVW) as a proxy for large growth stocks over the period 2000–2026.
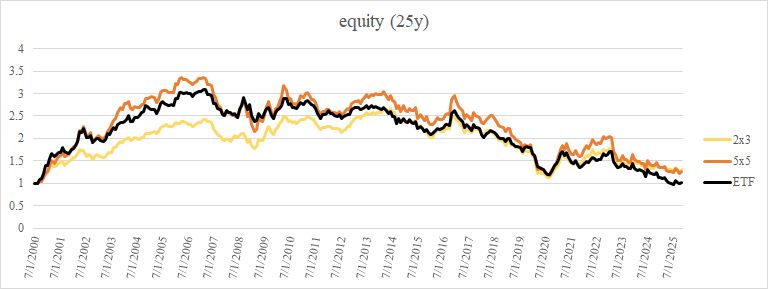
Figure 5. Comparison of ETF and Fama–French Spread Strategies (2000–2025)
Figure 5 shows the 25-year equity curve of the ETF spread together with the spreads constructed from the 2×3 and 5×5 Fama–French portfolios. The ETF spread behaves very similarly to the spreads derived from the Fama–French datasets, especially the 5×5 construction. However, the 2×3 spread also shows a relatively strong correlation with the ETF-based spread.
These findings suggest that the historical analysis based on the Fama–French portfolios provides a reasonable approximation of the behavior of investable value–growth spreads.
Systematic Strategies
Next, we tested whether the spread exhibits trend behavior using moving average signals.
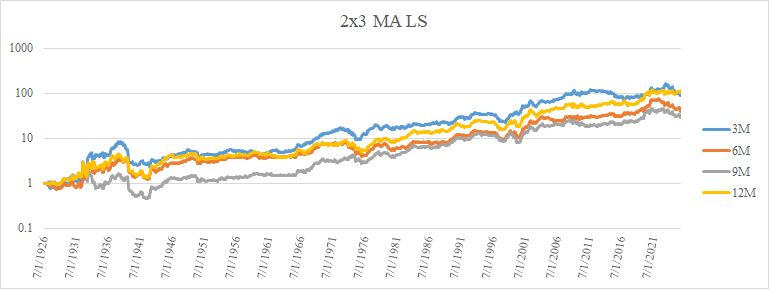
Figure 6. Equity Curve of the Long–Short Trend Strategy
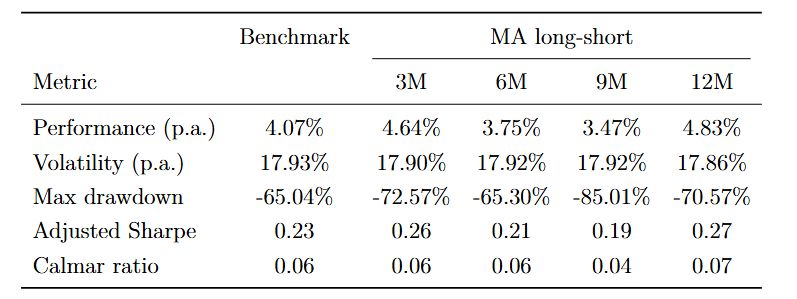
Table 3. Performance Statistics of the Moving Average Long–Short Strategy for Different Lookback Horizons
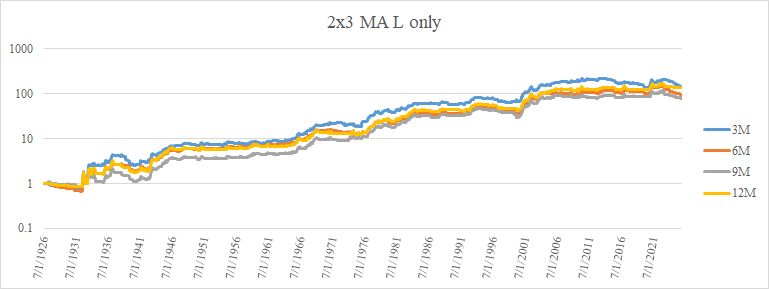
Figure 7. Equity Curve of the Long–Only Trend Strategy
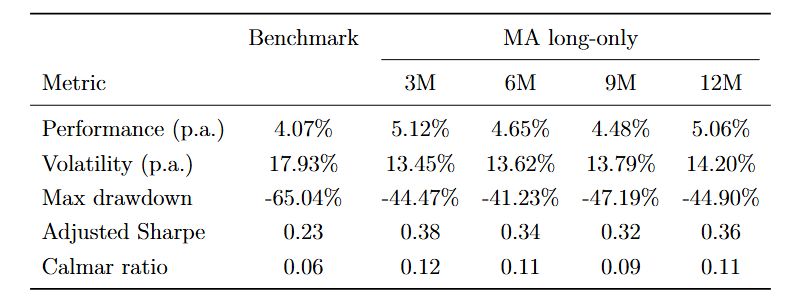
Table 4. Performance Statistics of the Moving Average Long–Only Strategy for Different Lookback Horizons
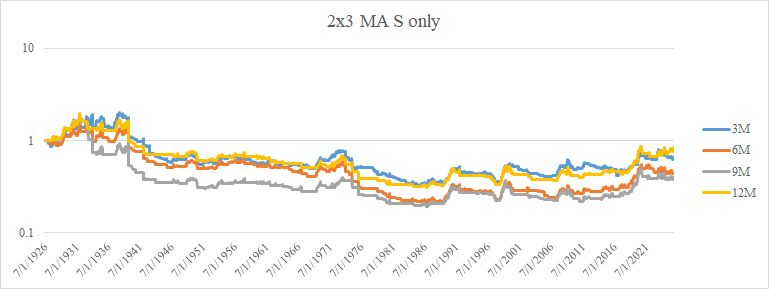
Figure 8. Equity Curve of the Short–Only Trend Strategy
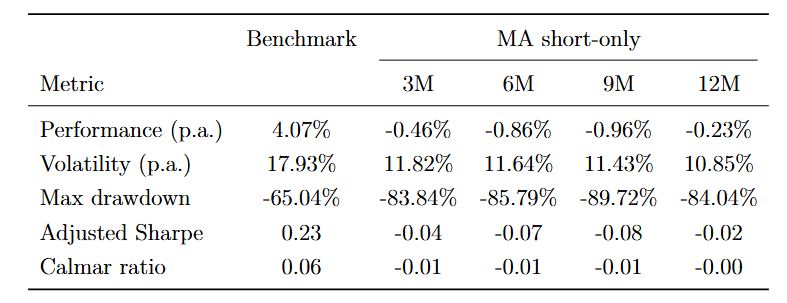
Table 5. Performance Statistics of the Moving Average Short–Only Strategy for Different Lookback Horizons
The results show that the SV–LG spread can be timed to some extent on the long side. However, the short side is much harder to time, and identifying periods when large growth outperforms small value is more difficult.
Even with a systematic trend-following approach, the strategy has been largely flat since 2008, meaning there has been no clear outperformance of small value relative to large growth in recent years. Another important finding is that strong outperformance of the SV–LG strategy occurred about four times over the past 100 years: in the 1930s–1940s, in the 1960s, in the 1970s, and in the early 2000s. These are the periods of major technology bubble bursts.
Finally, we also tested momentum signals. The results are qualitatively very similar to those obtained using moving averages and therefore are not reported separately.
To address the investability concerns of the 2×3 construction, we repeated the analysis using the 5×5 Fama–French portfolios.
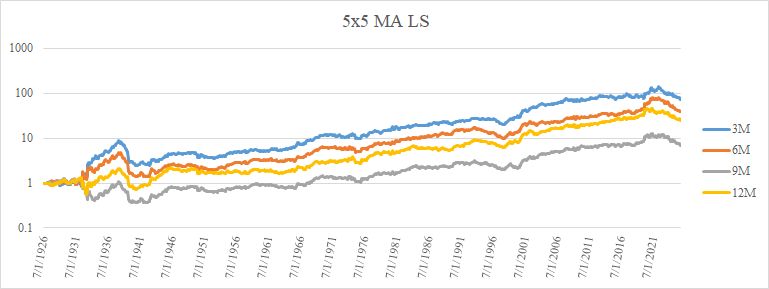
Figure 9. Equity Curve of the Long-Short Trend Strategy
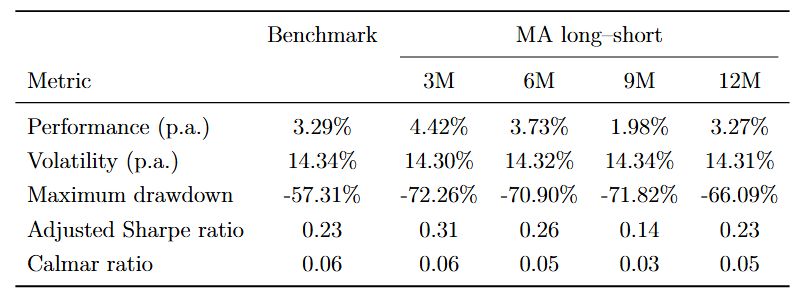
Table 6. Performance Statistics of the Moving Average Long-Short Strategy for Different Lookback Horizons
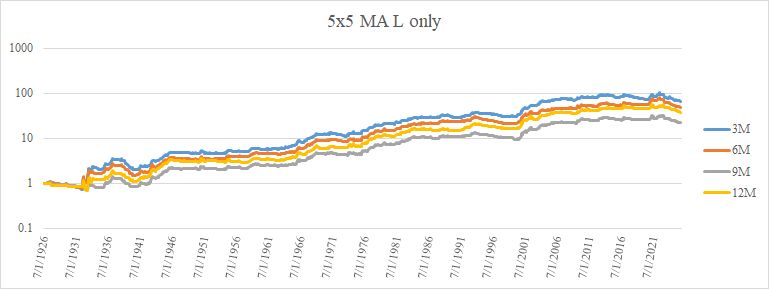
Figure 10. Equity Curve of the Long-Only Trend Strategy
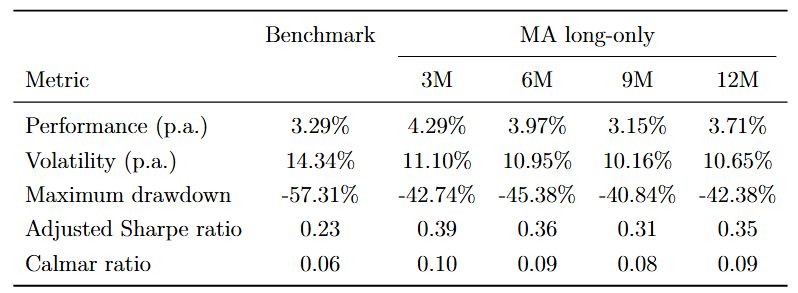
Table 7. Performance Statistics of the Moving Average Long-Only Strategy for Different Lookback Horizons
Performance statistics of the moving-average long-only strategy for different lookback horizons:
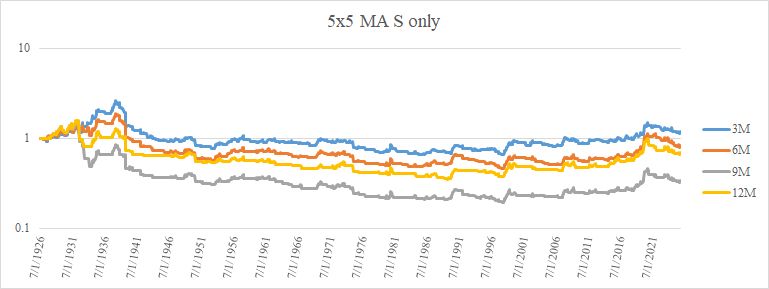
Figure 11. Equity Curve of the Short-Only Trend Strategy
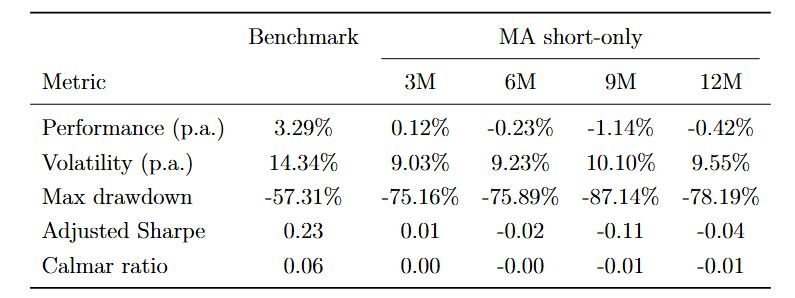
Table 8. Performance Statistics of the Moving Average Short-Only Strategy for Different Lookback Horizons
The results for the 5×5 portfolios are consistent with the findings from the 2×3 analysis. The spread between small value and large growth again shows only a few distinct periods of strong performance, once again, specifically during the 1930s–1940s, the 1960s, the 1970s, and the early 2000s. During most of the remaining sample period, the performance of the strategy remains relatively flat.
Similarly to the previous case, it is difficult to reliably time periods when large growth outperforms small value.
Momentum-based signals produce qualitatively the same results as the moving-average approach and therefore are not reported separately.
Conclusion
Overall, the results suggest that the most reliable approach is to hold a long position in value stocks relative to growth stocks. Attempts to systematically trying to predict periods when large growth stocks outperform small value stocks are difficult, but predicting small value outperformance is easier. Our analysis shows that strong value outperformance occurs during a few distinct periods in history, while during most of the time the spread remains relatively flat. These episodes of value outperformance often follow the bursting of major technology-driven market bubbles, when market leadership shifts away from previously dominant growth companies.
Over the past two decades, equity markets have been largely dominated by large growth firms, particularly technology companies. However, historical evidence suggests that such periods of growth dominance are cyclical rather than permanent. Given that the market has experienced more than twenty years of strong growth outperformance, it is possible that the next shift in market leadership could once again favor small value stocks.
Author: Margareta Pauchlyova, Quant Analyst, Quantpedia
Are you looking for more strategies to read about? Sign up for our newsletter or visit our Blog or Screener.
Do you want to learn more about Quantpedia Premium service? Check how Quantpedia works, our mission and Premium pricing offer.
Do you want to learn more about Quantpedia Pro service? Check its description, watch videos, review reporting capabilities and visit our pricing offer.
Do you want algorithmic access to the full Quantpedia database via the API? Subscribe to Quantpedia Pro, ask for an API key, and explore the in/out-of-sample statistics, source academic papers, and code snippets — ideal for quantitative research, systematic trading workflows, and AI model training.
Are you looking for historical data or backtesting platforms? Check our list of Algo Trading Discounts.
Or follow us on:
Facebook Group, Facebook Page, Telegram, Twitter, Linkedin, Medium or Youtube
References
Buffett, W. E. (1984). The Superinvestors of Graham-and-Doddsville. Hermes, 4, 15–15.
Fama, E. F., & French, K. R. (1992). The cross-section of expected stock returns. The Journal of Finance, 47(2), 427–465.
Fama, E. F., & French, K. R. (1993). Common risk factors in the returns on stocks and bonds. Journal of financial economics, 33(1), 3-56.
Fama, E. F., & French, K. R. (1998). Value versus growth: The international evidence. The Journal of Finance, 53(6), 1975–1999.
Graham, B., & Dodd, D. (2003). Security Analysis: The Classic 1940 Edition. New York: McGraw-Hill.
Lakonishok, J., Shleifer, A., & Vishny, R. W. (1994). Contrarian investment, extrapolation, and risk. The Journal of Finance, 49(5), 1541–1578.
Quantpedia (2025). Can Technology Sector Leadership Be Systematically Exploited? Available at the Quantpedia website.
Zhang, L. (2005). The value premium. The Journal of Finance, 60(1), 67–103.
Share onLinkedInTwitterFacebookRefer to a friend


