Low Risk Anomaly in Banking Industry and Its Implications

9.February 2018

Related mainly to #7 – Volatility Effect in Stocks – Long-Only Version:

Authors: Baker, Wurgler

Title: Do Strict Capital Requirements Raise the Cost of Capital? Bank Regulation and the Low Risk Anomaly

Link: https://papers.ssrn.com/sol3/papers.cfm?abstract_id=2967265

Abstract:

Traditional capital structure theory in frictionless and efficient markets predicts that reducing banks’ leverage reduces the risk and cost of equity but does not change the overall weighted average cost of capital (and thus the rates for borrowers). We test these two predictions. We confirm that the equity of better-capitalized banks has lower beta and idiosyncratic risk. However, over the last 40 years, lower risk banks have higher stock returns on a risk-adjusted or even a raw basis, consistent with a stock market anomaly previously documented in other samples. The size of the low risk anomaly within banks suggests that the cost of capital effects of capital requirements is large enough to be relevant to policy discussions. A calibration assuming competitive lending markets suggests that a binding ten percentage-point increase in Tier 1 capital to risk-weighted assets more than doubles banks’ average risk premium over Treasury yields, from 40 to between 100 and 130 basis points per year, and presumably raises rates for borrowers to a similar extent.

Notable quotations from the academic research paper:

"The instability of banks in the financial crisis has reignited debates about capital requirements. One of the ongoing concerns has been that capital requirements might affect banks’ overall cost of capital, and therefore lending rates and economic activity. Many bankers appear to prefer lower capital requirements. They argue that because equity is more expensive than debt, more of it clearly raises the overall cost of capital.

Economists, on the other hand, often view this argument as a fallacy. The textbook Modigliani-Miller logic is articulated by, for example, Admati, DeMarzo, Hellwig, and Pfleiderer (2011): “[B]ecause the increase in capital provides downside protection that reduces shareholders’ risk, shareholders will require a lower expected return to invest in a better capitalized bank”.

Real capital markets contain frictions and inefficiencies that challenge the Modigliani-Miller assumptions, however, so the relevance of the frictionless-irrelevance argument is not so clear. Many of these frictions have been studied, but there has been surprisingly little direct evidence on the basic proposition that reduced leverage reduces the cost of equity. In this paper, we study empirically how leverage has related to the risk and cost of bank equity and, in turn, to the overall cost of capital.

We are especially motivated by the possible interaction of capital requirements and the “low risk anomaly” within the stock market. That is, while stocks have on average earned higher returns than less risky asset classes like corporate bonds, which in turn have earned more than Treasury bonds, recent research emphasizes that the basic risk-return relationship within the stock market has historically been flat, if not inverted.

We use a large sample of historical U.S. data and proceed to test the two steps in the traditional argument. First, we relate bank equity betas estimated from CRSP to leverage ratios from quarterly reports. Second, we relate realized returns on equity to bank equity betas. We also replace beta with idiosyncratic risk. The two steps together then allow us to calibrate the effect of increased capital requirements on the cost of equity and, under certain assumptions, the overall cost of capital. We reach similar conclusions when we relate capital to returns directly over the sample with good data on risk-adjusted capital ratios.

We confirm that bank equity risk is sharply increasing in leverage. This is not surprising, and our work here extends that of Kashyap, Stein, and Hanson (2010). When capital is measured by the Tier 1 capital to risk-weighted assets ratio, the portfolio beta of the least-capitalized banks is 0.93 while the portfolio beta of the most-capitalized banks is 0.50. Higher capital ratios also predict lower idiosyncratic risk. Even this relatively large difference in beta is attenuated by two factors. Banks with riskier assets may choose to have larger capital cushions. This endogenous selection reduces the slope between beta and observed capital ratios.

Does a reduction in beta translate to a reduction in the cost of equity? The answer from 40 years of U.S. stock returns is no. The low risk anomaly is actually a bit stronger within banks than other firms. High-beta banks returned less than low-beta banks, even on a raw basis, and even in a period of mostly rising equity markets. Value-weighted returns are, on average, 16 basis points per month higher for a portfolio of the lowest three beta deciles than for a portfolio of the highest three beta deciles. The spread between low and high idiosyncratic risk portfolios is 6 basis points per month. These effects are not mediated by capitalization. Controlling for a size factor increases the risk-adjusted differences, especially for idiosyncratic risk portfolios. More simply, beta is positively correlated with capitalization while idiosyncratic risk is negatively correlated, yet both risk types are negatively related to average returns.

Putting the pieces together, the data suggest that more conservative capital structures reduce the risk of equity but may increase its cost, and the overall cost of capital, by bringing the low risk anomaly into play. To assess magnitudes, we focus on the beta anomaly and estimate how the overall cost of capital for a bank would have changed over this period given the hypothetical ten percentage-point increase in Tier 1 capital to risk-weighted assets experiment in Kashyap et al. (2010). A benchmark estimate of the pretax weighted average cost of capital for a typical bank implied by the Capital Asset Pricing Model over our sample period is 40 basis points per year above the risk-free rate. By reducing equity betas, banks with a full ten percentage point increase in Tier 1 capital would have added between 60 and 90 basis points to this spread, which would more than double the weighted average cost of capital over the risk-free rate to between 100 and 130 basis points. In a competitive lending market this would have translated to a similar increase in rates faced by borrowers."


Are you looking for more strategies to read about? Check http://quantpedia.com/Screener

Do you want to see performance of trading systems we described? Check http://quantpedia.com/Chart/Performance

Do you want to know more about us? Check http://quantpedia.com/Home/About

Continue reading

Can Momentum Investing Be Saved?

2.February 2018

Related mainly to equity based momentum strategies:

Authors: Arnott, Kalesnik, Kose, Wu

Title: Can Momentum Investing Be Saved?

Link: https://papers.ssrn.com/sol3/papers.cfm?abstract_id=3099687

Abstract:

On paper, momentum is one of the most compelling factors: simulated portfolios based on momentum add remarkable value, in most time periods and in most asset classes, all over the world. So, our title may seem unduly provocative. However, live results for mutual funds that take on a momentum factor loading are surprisingly weak. No US-benchmarked mutual fund with “momentum” in its name has cumulatively outperformed its benchmark since inception, net of fees and expenses. Worse, because the standard momentum factor gave up so much ground in the last momentum crash of 2008–2009, it remains underwater in the United States, not only compared to its 2007 peak, but even relative to its 1999 performance peak. This means 18 years with no alpha, before subtracting trading costs and fees!

To be sure, most advocates of momentum investing will disavow the standard model, and will claim they use proprietary momentum strategies with better simulated, and perhaps better live, performance. A handful (especially in the hedge fund community) may be able to point to respectable fund performance, net of trading costs and fees. But a careful review of the competitive landscape reveals that most claims of the merits of momentum investing are not supported by data, particularly not live mutual fund results, net of trading costs and fees.

The three traps for momentum investing are 1) high turnover, in crowded trades, which leads to high trading costs; 2) a careless sell discipline, because momentum’s profits accrue for months, not years, and then reverse course; and 3) repeat winners (and losers), which have been soaring (or tumbling) for so very long they enjoy little or no momentum follow-through. Each of these traps can be avoided. By evading these traps, we can narrow the gap between paper and live results. Yes, momentum can probably be saved, even net of fees and trading costs.

This is the fourth and final article in the Alice in Factorland series.

Notable quotations from the academic research paper:

"One weakness of standard momentum strategies is that they do not distinguish between stocks as to whether they are early or late in their momentum cycles. We call the first group fresh momentum and the latter stale momentum. Stale momentum stocks are typically very expensive on the long side, and very cheap on the short side, with little likelihood of follow-through. Fresh momentum fares much better than stale momentum, especially since standard momentum went off the rails at the start of the current century. Investors will be better off if their strategies avoid stocks with stale momentum and instead rely more heavily on stocks with fresh momentum. If we’re going to incur trading costs to initiate momentum trades, we should perhaps concentrate those trades in the fresh momentum segment of the portfolio.

pic 1


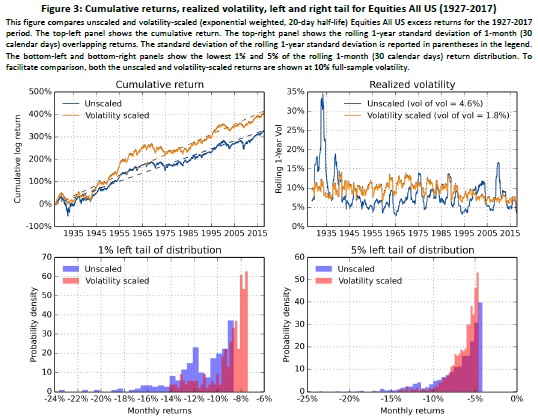
Another weakness of most momentum strategies is high turnover and high trading costs. Momentum funds use momentum to initiate momentum trades. Why don’t we turn this logic on its head? Why not use momentum to block (or at least condition) trades for other strategies, such as value, quality, low volatility, Fundamental Index, and so forth? Using momentum to block trades should improve performance on two levels. First, our strategy will be trading less, not more; after all, we incur no trading costs when we are deferring a trade. Second, the momentum effect — without trading costs — is one of the most robust in the literature, notwithstanding recent disappointments. If momentum — especially fresh momentum — improves the timing of our trades, we extract momentum alpha while reducing our trading costs, giving us the best of both worlds.

Momentum — at least as defined by the standard momentum factor — clearly does more harm than good on live assets in the mutual fund arena. It need not. It clearly needs saving. With a few simple steps, we think it can be saved, though not necessarily on a vast asset base."


Are you looking for more strategies to read about? Check http://quantpedia.com/Screener

Do you want to see performance of trading systems we described? Check http://quantpedia.com/Chart/Performance

Do you want to know more about us? Check http://quantpedia.com/Home/About

Continue reading

Are There Any Simple Calendar Effects in Bitcoin Market?

24.January 2018

Is Bitcoin market efficient ? A new research study analyzes simple calendar effects:

Authors: Baur, Cahill, Godfrey, Liu

Title: Bitcoin Time-of-Day, Day-of-Week and Month-of-Year Effects in Returns and Trading Volume

Link: https://papers.ssrn.com/sol3/papers.cfm?abstract_id=3088472

Abstract:

There is a large literature that reports time-specific anomalies in equity markets such as the Monday effect, the January effect and the Halloween effect. This study is the first to report intra-day time-of-day, day-of-week, and month-of-year effects for Bitcoin returns and trading volume. Using more than 15 million price and trading volume observations from seven global Bitcoin exchanges reveal time-varying effects but no consistent or persistent patterns across the sample period. The results suggest that Bitcoin markets are efficient.

Notable quotations from the academic research paper:

"The aim of this paper is to analyze market efficiency by testing for time-dependent anomalies in returns and trading volume. For example, do Bitcoin investors trade differently when major stock exchanges are open compared to when they are closed? Do they trade less on weekends and during the Northern hemisphere summer months (i.e., June – August)? To answer these types of questions, we analyze time-of-the-day (ToD), day-of-the-week (DoW) and month-of-the-year (MoY) patterns in Bitcoin returns and trading volume.

Given the conflict between efficient pricing and the seemingly irrational demand for Bitcoin, we look for any consistent patterns in returns that would contradict the efficient market hypothesis. Since Bitcoin is a relatively new and unregulated asset, it is possible that the market has been dominated by retail investors. This suggests that we can expect to find inefficiencies and return anomalies in Bitcoin pricing. The fact that Bitcoin is continuously and globally traded makes an analysis of time-of-day, day-of-week, and month-of-year effects particularly interesting to study. Moreover, since Bitcoin is traded in different currencies and in different geographic locations, the market provides an additional layer of complexity similar to foreign exchange and commodities.

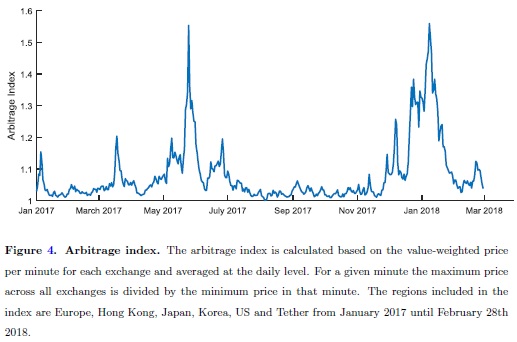
Our analysis of time-of-day, day-of-week and month-of-year patterns shows evidence of time-specific anomalies such as a lower weekend volume effect and a higher Monday return effect which are more consistent with currency markets.

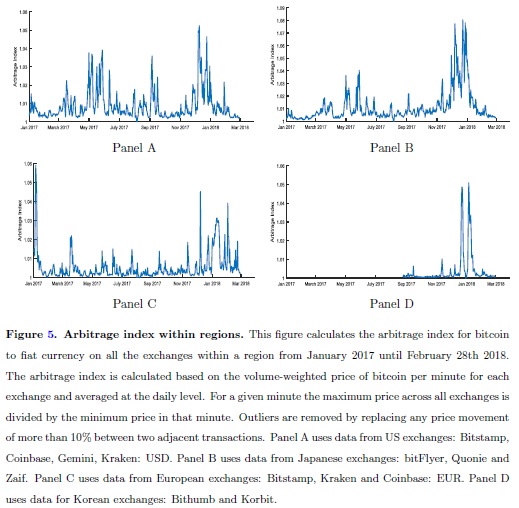
We find increased trading activity on Bitcoin exchanges at times when U.S stock exchanges are open and lower trading activity between midnight and the early morning on most exchanges. Bitcoin exchanges denominated in USD display stronger patterns compared to exchanges denominated in Japanese yen and Chinese yuan. We use heatmaps to illustrate patterns in returns and trading volume both across time and across exchanges.

The results support the view that Bitcoin markets are weak-form efficient because we do not see any consistent price pattern that could be exploited based on historical information. We also use statistical tests to check the robustness of the heatmap analysis and to determine the statistical significance of the effects."


Are you looking for more strategies to read about? Check http://quantpedia.com/Screener

Do you want to see performance of trading systems we described? Check http://quantpedia.com/Chart/Performance

Do you want to know more about us? Check http://quantpedia.com/Home/About

Continue reading

Crash Sensitivity Explains the Momentum Effect in Stocks

17.January 2018

Related mainly to equity based momentum strategies:

Authors: Ruenzi, Weigert

Title: Momentum and Crash Sensitivity

Link: https://papers.ssrn.com/sol3/papers.cfm?abstract_id=3092546

Abstract:

This paper proposes a risk-based explanation of the momentum anomaly on equity markets. Regressing the momentum strategy return on the return of a self-financing portfolio going long (short) in stocks with high (low) crash sensitivity in the USA from 1963 to 2012 reduces the momentum effect from a highly statistically significant 11.94% to an insignificant 1.84%. We find additional supportive out-of sample evidence for our risk-based momentum explanation in a sample of 23 international equity markets.

Notable quotations from the academic research paper:

"Although momentum is widely documented on fi nancial markets, there is still an active ongoing debate about its main drivers and determinants. While most studies advocate a behavioral explanation for the eff ect, i.e., momentum is driven by either overreaction or underreaction of investors, recent studies point out the riskiness of momentum strategies.

Motivated by these recent results, we investigate whether momentum profi ts are driven by exposure of the momentum strategy to a systematic crash risk factor. Speci cally, we regress the momentum portfolio long-short return (UMD) on the return of a self- financing portfolio that buys stocks with high crash sensitivity and sells stocks with low crash sensitivity (CRASH) on the US stock market in the period from 1963 to 2012. The crash sensitivity of individual stocks is measured based on the lower tail dependence of their return time series with the market return time series (see Chabi-Yo, Ruenzi, and Weigert, 2017). Our results indicate that the momentum strategy loads signi ficantly positive on the crash sensitivity factor. While simultaneously controlling for the Fama and French (1993) factors, we show that including the crash sensitivity factor as an explanatory variable for the momentum return reduces its annualized alpha from a statistically signifi cant 11.94% to an insigni ficant 1.84%, i.e., a percentage decrease of almost 85%.

As an out-of-sample check we also examine the relationship between the momentum return and the crash sensitivity factor on 23 international equity markets. We find that in 22 countries (i.e., in all countries except of Singapore) momentum loads positively on systematic crash sensitivity with corresponding statistical signifi cance (at least on the 10% level) in 13 countries. Including the crash sensitivity factor as an explanatory variable in the regression setup lowers the alpha of momentum returns in 22 countries and enhances the adjusted R-square in 20 countries of our international sample. Overall, our findings show that at least a substantial part of U.S. and international momentum pro fits represents a risk premium for the exposure of the strategy to systematic crash risk."


Are you looking for more strategies to read about? Check http://quantpedia.com/Screener

Do you want to see performance of trading systems we described? Check http://quantpedia.com/Chart/Performance

Do you want to know more about us? Check http://quantpedia.com/Home/About

Continue reading

Summing-Up Insights into Momentum Strategies

13.January 2018

Related to all momentum based strategies:

Authors: Roncalli

Title: Keep Up the Momentum

Link: https://papers.ssrn.com/sol3/papers.cfm?abstract_id=3083921

Abstract:

The momentum risk premium is one of the most important alternative risk premia alongside the carry risk premium. However, it appears that it is not always well understood. For example, is it an alpha or a beta exposure? Is it a skewness risk premium or a market anomaly? Does it pursue a performance objective or a hedging objective? What are the differences between time-series and cross-section momentum? What are the main drivers of momentum returns? What does it mean when we say that it is a convex and not a concave strategy? Why is the momentum risk premium a diversifying engine, and not an absolute return strategy?

The goal of this paper is to provide specific and relevant answers to all these questions. The answers can already be found in the technical paper "Understanding the Momentum Risk Premium" published recently by Jusselin et al. (2017). However, the underlying mathematics can be daunting to readers. Therefore, this discussion paper presents the key messages and the associated financial insights behind these results.

Among the main findings, one result is of the most importance. To trend is to diversify in bad times. In good times, trend-following strategies offer no significant diversification power. Indeed, they are beta strategies. This is not a problem, since investors do not need to be diversified at all times. In particular, they do not need diversification in good times, because they do not want that the positive returns generated by some assets to be cancelled out by negative returns on other assets. This is why diversification may destroy portfolio performance in good times. Investors only need diversification in bad economic times and stressed markets.

This diversification asymmetry is essential when investing in beta strategies like alternative risk premia. On the contrary, this diversification asymmetry is irrelevant when investing in absolute return strategies. However, we know that generating performance with alpha strategies is much more difficult than generating performance with beta strategies. Therefore, beta is beautiful, but convex beta is precious and scarce. Among risk premia, momentum is one of the few strategies to offer this diversification asymmetry. This is why investing in momentum is a decision of portfolio construction, and not a search for alpha.

Notable quotations from the academic research paper:

"Key Takeaways:

The performance of momentum strategies depends on three main parameters:
   – The absolute value of Sharpe ratios
   – The correlation matrix of asset returns
   – The moving average duration to estimate the trends

Time-series momentum likes zero-correlated assets. This is why time-series momentum makes sense in a multi-asset framework.

Cross-section-momentum likes highly correlated assets. This is why cross-section momentum makes sense within a universe of homogenous assets, e.g. a universe of stocks that belong to the same region.

Short-term momentum is more risky than long-term momentum. Therefore, the cross-section dispersion of short-term momentum returns is broader than the cross-section dispersion of long-term momentum returns.

The Sharpe ratio of long-term momentum is higher than the Sharpe ratio of short-term momentum.

The choice of the moving average estimator is more crucial for short-term momentum than for long-term momentum.

Too much leverage can be harmful for the strategy, since momentum portfolios are not homothetic transformations with respect to the portfolio's leverage.

The payoff of a trend-following strategy is a long straddle option profi le. Therefore, trend-following strategies exhibit a convex payoff .

Trend-following portfolios are not absolute return strategies. In the long-run, trend-following strategies present a low moderate correlation with traditional asset classes. However, it is an illusion due to long-term averaging, since they present either a high positive or a high negative beta.

The main motivation of momentum investing is diversi fication, not performance. The convexity of trend-following strategies mitigates the risk of diversi fied portfolios in bad times. This is why momentum strategies must be located in diversifying buckets, and not in absolute return buckets. Therefore, analysing the risk/return trade-off of momentum strategies on a standalone basis does not make sense.

It follows that momentum risk premium is key for building an alternative risk premia portfolio.

"


Are you looking for more strategies to read about? Check http://quantpedia.com/Screener

Do you want to see performance of trading systems we described? Check http://quantpedia.com/Chart/Performance

Do you want to know more about us? Check http://quantpedia.com/Home/About

Continue reading

Deep Learning Insights for Factor Investing

3.January 2018

Deep learning is a very popular area of research and is used in a lot of industries. We link to a new paper which gives interesting insights about equity factor investing:

Authors: Messmer

Title: Deep Learning and the Cross-Section of Expected Returns

Link: https://papers.ssrn.com/sol3/papers.cfm?abstract_id=3081555

Abstract:

Deep learning is an active area of research in machine learning. I train deep feedforward neural networks (DFN) based on a set of 68 firm characteristics (FC) to predict the US cross-section of stock returns. After applying a network optimization strategy, I find that DFN long-short portfolios can generate attractive risk-adjusted returns compared to a linear benchmark. These findings underscore the importance of non-linear relationships among FC and expected returns. The results are robust to size, weighting schemes and portfolio cutoff points. Moreover, I show that price related FC, namely, short-term reversal and the twelve-months momentum, are among the main drivers of the return predictions. The majority of FC play a minor role in the variation of these predictions.

Notable quotations from the academic research paper:

"This study includes cross-sectional stock data from the CRSP/Compustat database from 1970-2014. In total I use 68 published FC, constructed based on accounting and market data. The focus of the analysis lies solely on large and mid cap stocks, to prevent a potential contamination arising from economically unimportant small and micro-cap stocks.

Training a deep neural network for stock picking, is at least partly motivated by a recent important contribution to the open source software community. The so called ”Tensorflow” library provides a highly scalable and flexible machine learning framework, allowing an efficient usage of DL networks and is the core implementation of Google’s artificial intelligence (AI), unit which is under active development. Moreover, the US cross-section of returns is a relative data rich environment. In this application, roughly 2.1 million observations provide a fertile ground for these parameter rich networks.

On the other hand, it is hard to assess ex-ante if these methods are suitable for predicting stock returns, due to the inherently different statistical character they possess — for example, the signal-to-noise ratio of a stock return process is a tiny fraction compared to the processes typically encountered in computer science.

The main contribution of this work lies in the investigation if recent developments in artificial intelligence are of any use predicting cross-sectional stock returns. Applying artificial neural networks (ANN) in finance is not new. Hence, past attempts have to be distinguished. This study can be seen as an extension to earlier attempts of applying ANN to predict stock returns, with the difference of having access to additional regularization techniques, better computational resources and more data. Additionally, it is, to best of my knowledge, the first study which investigates the cross-section and its relation to a rich set of published FC by exploiting a purely data-driven algorithm without any prior assumption on the functional relation between FC and expected return spreads.

Precisely, this paper aims at answering the following main three research questions: First, how can one efficiently employ a DFN framework for the purpose of return predictions? Second, do DFN based predictions add additional economic value compared to a parsimonious linear approach utilizing the same information set? Third, which set of FC drive the prediction results and how far do they differ from recent findings in the literature of FC selection.

The first question is related to the selection problem of the optimal DFN design for this exercise. I address this question by stating the problem as an outer optimization problem. This computational intensive task is tackled by utilizing a random search algorithm as proposed in Bergstra and Bengio (2012) in combination with a one-dimensional grid search for learning rate tuning. The procedure reveals that many network designs fail to deliver reasonable numerical behavior. Despite a relatively high failure rate, I identify architectures which show promising improvements compared to the linear benchmarks based on a validation data set.

The short answer whether economically measurable improvements can be achieved, is yes. I find significant and robust factor alpha ’s, which are consistently higher compared to the parsimonious linear benchmark. In many (but not in all) cases I document significant higher Sharpe Ratios (SR). No specification favors the linear model, irrespectively of which performance measure is considered. However, a naive strategy is sensitive to trading cost adjustments for both approaches. Nonetheless, I show that a simple rebalancing frequency adjustment leads to stark improvements. An explicit rebalancing optimization is not carried out and can be seen as a limitation of this work. Over the sample period, I document that DFN based portfolios perform much weaker during high volatility periods compared to times of calmer markets, a phenomena which is characteristical for momentum based strategies. Controlling for momentum exposure during these times, levels the alpha’s significantly into the positive domain.

The answer to the question which FC drive the predictions points unambiguously at price based information, predominantly short-term reversal (providing an explanation for the turnover intensity) and the twelve-months momentum. However, I study the impact purely by looking at prediction changes arising from variation in the input data. As a result, it can not be seen as a perfect measure, but a computational trivial way in gaining model insights at this stage.

"


Are you looking for more strategies to read about? Check http://quantpedia.com/Screener

Do you want to see performance of trading systems we described? Check http://quantpedia.com/Chart/Performance

Do you want to know more about us? Check http://quantpedia.com/Home/About

Continue reading
Subscription Form

Subscribe for Newsletter

 Be first to know, when we publish new content
logo
The Encyclopedia of Quantitative Trading Strategies

Log in