Dual vs. Single Momentum in Commodities: Enhancing Risk-Adjusted Returns through Absolute Trend Filtering
Commodities represent a vital but highly volatile asset class, characterized by pronounced cyclicality, lack of yield, and susceptibility to severe macroeconomic drawdowns. While cross-sectional (relative) momentum is a well-documented anomaly, its application in commodities often forces portfolios to hold the “least declining” assets during broad-based bear markets, resulting in unacceptable tail-risk. This study empirically evaluates the efficacy of a Dual Momentum framework—combining relative strength ranking with an absolute time-series trend filter—applied to a diversified suite of commodity sector ETFs (DBA, DBB, DBE, DBP) from 2007 to 2026. We demonstrate that while pure relative momentum exhibits high parameter sensitivity and inconsistent benchmark outperformance, the inclusion of an absolute momentum filter structurally mitigates drawdowns and universally outperforms a static, equally weighted benchmark across all tested parameter combinations. The findings suggest that Dual Momentum provides a robust, parameter-agnostic framework for portfolio managers seeking tactical commodity exposure with superior risk-adjusted return profiles.
1. Introduction
The strategic allocation to commodities has long been advocated for portfolio diversification and inflation hedging. However, the inherent volatility and cyclical nature of commodity markets pose significant challenges for static allocation strategies. Traditional buy-and-hold approaches often experience prolonged capital depreciation, necessitating dynamic tactical asset allocation (GTAA) overlays. Among dynamic strategies, momentum remains one of the most persistent and robust factor premiums in financial markets. Yet implementing momentum in commodities requires careful structural consideration to avoid the pitfalls of cross-sectional ranking during systemic downturns.
1.1 Background
Momentum strategies are broadly categorized into two distinct paradigms: cross-sectional (relative) momentum and time-series (absolute) momentum. Cross-sectional momentum ranks assets against one another, systematically overweighting recent outperformers and underweighting laggards. While effective in equities, this approach is inherently flawed in unconstrained commodity markets; during a global commodity bear market, relative momentum will simply allocate capital to the assets that are declining the slowest, offering no capital preservation.
Conversely, time-series momentum evaluates an asset’s current price relative to its historical trajectory, effectively serving as a trend-following mechanism. By synthesizing these two approaches, investors can isolate relative outperformers within a universe while simultaneously enforcing a macroeconomic veto, ensuring capital is deployed only when the broader trend is favorable. This synthesis forms the foundation of the Dual Momentum framework, which seeks to capture the alpha of relative strength while utilizing absolute trends as a structural circuit breaker against severe drawdowns.
1.1.1 Theory
The academic foundation of momentum traces back to Jegadeesh and Titman (1993), who first documented the persistence of cross-sectional returns in equities and attributed it to behavioral biases and delayed information diffusion. In the context of commodities, Moskowitz, Ooi, and Pedersen (2012) established the efficacy of time-series momentum (trend-following), demonstrating that commodity futures exhibit strong serial correlation that can be exploited to generate positive risk-adjusted returns across various market regimes. Antonacci (2014) later formalized the integration of these concepts into the Dual Momentum framework, proving that combining relative asset selection with an absolute trend filter mathematically dominates single-factor approaches by truncating the left tail of the return distribution.
1.1.2 Motivation
Our recent quantitative research, including extensive analyses of Global Tactical Asset Allocation (GTAA) and specific dual-momentum applications to assets such as Bitcoin and Gold (Quantpedia, 2024; 2025), also highlights the superiority of absolute filters in mitigating regime-specific risks. Furthermore, models such as the Pragmatic Asset Allocation (PAA) framework emphasize the need for semi-active, risk-aware overlays that adapt to market conditions without incurring the excessive turnover of high-frequency tactical models.
Partially, we aim to develop a strategy suitable for diversification of a wide variety of multi-asset portfolios. Commodities often exhibit low correlation to traditional equities and fixed income, making them ideal candidates for tactical overlays. However, a reliable overlay must not introduce uncompensated volatility.
Hypothesis Development:
We hypothesize that the inclusion of an absolute momentum filter will structurally improve the risk-to-return profile of a relative momentum strategy in commodities. By forcing the portfolio into cash when relative leaders violate their long-term moving averages, the strategy should exhibit profound drawdown mitigation, rendering it robust across varying parameter selections and market regimes.
2. Methodology
2.1 Data
To avoid the idiosyncratic risks and roll-yield complexities associated with individual commodity futures or single-commodity ETFs (e.g., USO, GLD, WEAT), we construct an investment universe comprising four broad commodity sector ETFs. This ensures diversified exposure across distinct macroeconomic drivers:
- DBA: Invesco DB Agriculture Fund
- DBB: Invesco DB Base Metals Fund
- DBE: Invesco DB Energy Fund
- DBP: Invesco DB Precious Metals Fund
The backtest spans from January 5, 2007, to February 27, 2026, capturing multiple macroeconomic cycles, including the 2008 Global Financial Crisis, the 2014-2015 energy crash, the 2020 pandemic shock, and the subsequent inflationary surge. Data is sourced via EODHD.com – the sponsor of our blog, utilizing adjusted close prices to account for corporate actions and distributions. EODHD offers seamless access to +30 years of historical prices and fundamental data for stocks, ETFs, forex, and cryptocurrencies across 60+ exchanges, available via API or no-code add-ons for Excel and Google Sheets. As a special offer, our blog readers can enjoy an exclusive 30% discount on premium EODHD plans.
2.2 Benchmark
The baseline for comparison is a static, Equally-Weighted (EW) Buy-and-Hold portfolio of the four ETFs (25% allocation each). Crucially, this benchmark is not rebalanced over time, reflecting a passive, naive allocation strategy that allows weights to drift in line with market capitalization and performance.
The performance and risk metrics for the static benchmark are detailed below:
| Metric | Benchmark (Static B&H) |
|---|---|
| Performance (p.a.) * | 4.76% |
| Volatility (p.a.) * | 15.79% |
| Sharpe Ratio ** | 0.30 |
| Max Drawdown | -53.25% |
| Calmar Ratio *** | 0.09 |
Footnotes (explained only once and applicable for all reported tables): * annualized (252 trading days); ** adjusted (0% Risk Free); *** (Perf/Max DD)
Note: In subsequent optimization tables, a distinct visual separator line will denote the benchmark’s Sharpe Ratio (0.30) to provide immediate context regarding the relative efficacy of the tested parameter combinations.

2.3 Methods
The strategy universe consists of assets. We evaluate two distinct momentum frameworks across a grid of parameters:
- Lookback Period (): 3, 6, 9, and 12 months.
- Breadth (): Top 1, 2, or 3 assets selected from the universe.
Case A: Relative Momentum (Single Variant)
At the end of the month (EOM), assets are ranked based on their -month Rate of Change (RoC). The top assets are selected and equally weighted. This model forces exposure to the strongest relative performers, regardless of their absolute price trajectory.
Case B: Dual Momentum
This model applies the same relative ranking mechanism but introduces an absolute time-series filter. We calculate the -month Simple Moving Average (SMA) for each asset (where the SMA lookback is constrained to equal the momentum lookback , elegantly preventing parameter overfitting). The top assets are selected only if their current price is strictly greater than their -month SMA. Assets that fail this absolute trend filter are replaced with cash (0% yield).
Both strategies rebalance monthly. To isolate the signal’s efficacy, transaction costs are modeled at 0 bps, and the risk-free rate is set to 0%.
3. Results
3.1 Single Variant: Relative Momentum
The optimization grid for the pure relative momentum strategy reveals a high degree of parameter sensitivity. While certain combinations generate substantial alpha, a significant portion of the parameter space fails to beat the naive benchmark.
| Lookback (X) | Breadth (M) | Return (p.a.) | Volatility (p.a.) | Sharpe Ratio | Max Drawdown | Calmar Ratio |
|---|---|---|---|---|---|---|
| 6 | 1 | 11.51% | 23.44% | 0.49 | -63.94% | 0.18 |
| 6 | 2 | 6.60% | 17.52% | 0.38 | -52.08% | 0.13 |
| 6 | 3 | 5.93% | 15.79% | 0.38 | -47.80% | 0.12 |
| 9 | 2 | 5.53% | 17.34% | 0.32 | -52.12% | 0.11 |
| 3 | 3 | 4.98% | 16.14% | 0.31 | -54.26% | 0.09 |
| _____________ | _____________ | _____________ | _____________ | _____________ | _____________ | _____________ |
| 9 | 3 | 4.48% | 15.56% | 0.29 | -47.30% | 0.09 |
| 3 | 2 | 4.50% | 17.84% | 0.25 | -54.72% | 0.08 |
| 3 | 1 | 4.79% | 23.54% | 0.20 | -69.61% | 0.07 |
| 12 | 3 | 3.02% | 15.49% | 0.20 | -55.16% | 0.05 |
| 12 | 2 | 3.29% | 17.22% | 0.19 | -60.15% | 0.05 |
| 12 | 1 | 4.02% | 22.69% | 0.18 | -65.72% | 0.06 |
| 9 | 1 | 2.86% | 23.30% | 0.12 | -83.75% | 0.03 |
Table 1: Relative Momentum Optimization Results. The bolded separator indicates the benchmark’s Sharpe Ratio threshold.
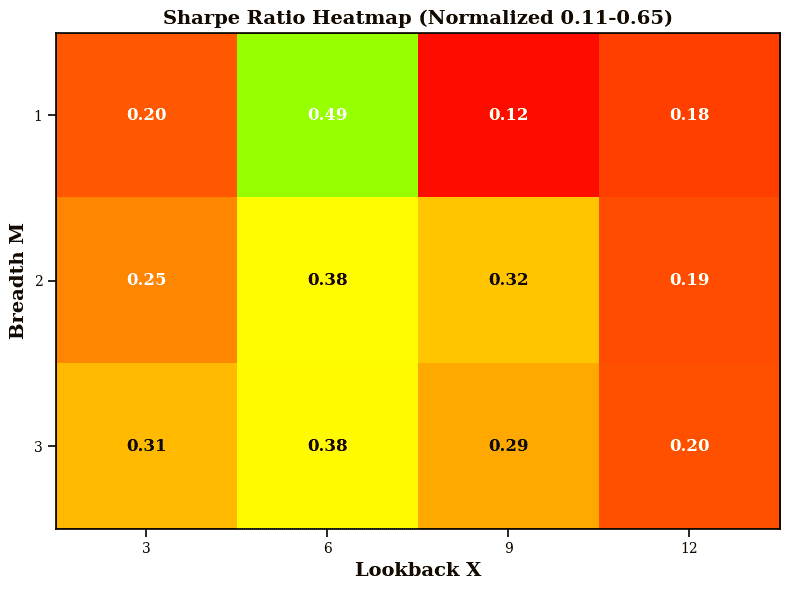
Analysis:
The pure relative momentum strategy is highly sensitive to parameter selection. While a practitioner could theoretically optimize for the 6-month top-1 asset configuration (Sharpe ratio 0.49), doing so would introduce severe concentration risk and a maximum drawdown of -63.94%. Furthermore, 7 out of the 12 tested parameter combinations fail to exceed the benchmark’s Sharpe ratio of 0.30. This lack of robustness across the parameter space indicates that relative momentum alone is an unreliable tactical overlay for commodities, as it routinely fails to protect capital during broad-based sector corrections.
3.2 Dual Momentum
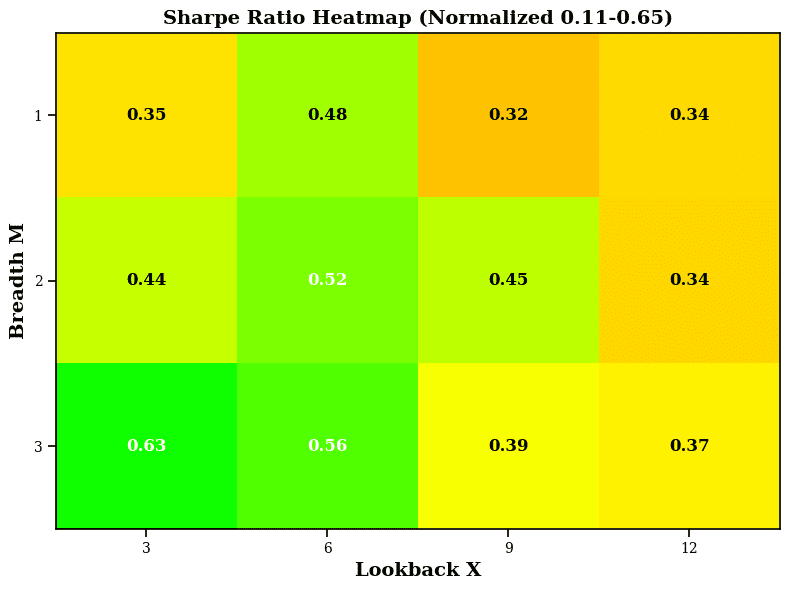
The introduction of the absolute trend filter fundamentally alters the return distribution, truncating the left tail and elevating the Sharpe ratio across the entire parameter grid.
| Lookback (X) | Breadth (M) | Return (p.a.) | Volatility (p.a.) | Sharpe Ratio | Max Drawdown | Calmar Ratio |
|---|---|---|---|---|---|---|
| 3 | 3 | 7.54% | 11.92% | 0.63 | -30.07% | 0.25 |
| 6 | 3 | 6.89% | 12.20% | 0.56 | -38.23% | 0.18 |
| 6 | 2 | 7.59% | 14.67% | 0.52 | -41.13% | 0.18 |
| 6 | 1 | 10.03% | 20.92% | 0.48 | -58.65% | 0.17 |
| 9 | 2 | 6.60% | 14.74% | 0.45 | -39.37% | 0.17 |
| 3 | 2 | 6.57% | 14.90% | 0.44 | -32.58% | 0.20 |
| 9 | 3 | 4.79% | 12.33% | 0.39 | -37.52% | 0.13 |
| 12 | 3 | 4.35% | 11.89% | 0.37 | -34.60% | 0.13 |
| 3 | 1 | 7.21% | 20.53% | 0.35 | -46.08% | 0.16 |
| 12 | 1 | 7.05% | 20.72% | 0.34 | -47.16% | 0.15 |
| 12 | 2 | 4.96% | 14.75% | 0.34 | -42.33% | 0.12 |
| 9 | 1 | 6.60% | 20.85% | 0.32 | -67.75% | 0.10 |
| _____________ | _____________ | _____________ | _____________ | _____________ | _____________ | _____________ |
Table 2: Dual Momentum Optimization Results. The bolded separator indicates the benchmark’s Sharpe Ratio threshold.

Analysis:
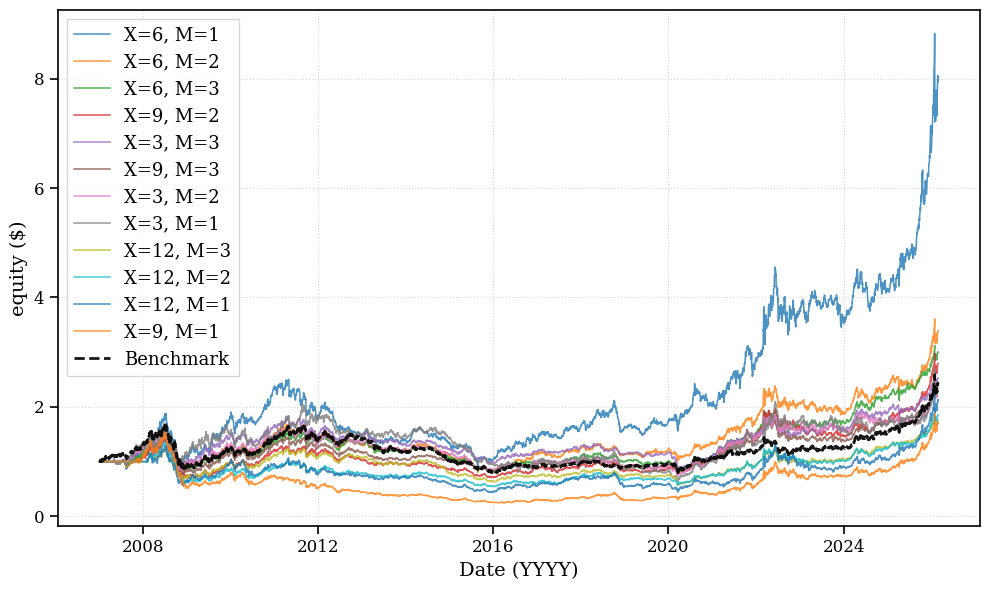
The results for the Dual Momentum framework are striking. All 12 parameter combinations outperform the static benchmark across Sharpe Ratio, Annualized Return, and Calmar Ratio. The most optimal configuration (3-month lookback, top 3 assets) achieves a Sharpe Ratio of 0.63 while cutting the maximum drawdown nearly in half compared to the benchmark (-30.07% vs. -53.25%). This demonstrates that the absolute momentum filter serves as a highly effective regime filter, ensuring the strategy captures relative strength only when the broader commodity complex is in a structural uptrend.
4. Conclusions
The empirical evidence overwhelmingly supports the hypothesis that an absolute momentum filter structurally improves the risk-adjusted return profile of commodity momentum allocations. The core deficiency of pure relative momentum in commodities is its blindness to macroeconomic regimes. During events such as the 2008 financial crisis or the 2014 oil glut, all commodity sectors may enter severe downturns. A relative model is mathematically forced to allocate capital to the “best of the worst,” resulting in catastrophic drawdowns that permanently impair compound annual growth rates (CAGR).
We found that while relative momentum can generate sporadic alpha, it lacks the structural robustness required for institutional deployment, frequently underperforming a naive buy-and-hold benchmark and exposing the portfolio to severe, unmitigated drawdowns. Conversely, the Dual Momentum framework universally outperformed the benchmark across all tested lookback and breadth parameters. By enforcing a time-series constraint (price > SMA), the Dual Momentum model grants the portfolio permission to step aside into cash. This seemingly simple mechanism drastically reduces volatility and truncates left-tail risk, which mathematically elevates the Sharpe and Calmar ratios.
From a practitioner’s perspective, the most critical takeaway is parameter robustness. In live trading, optimizing for a single “best” parameter combination is a recipe for overfitting and out-of-sample failure. The Dual Momentum framework’s ability to beat the benchmark across all of the tested grid provides portfolio managers with the confidence to deploy the strategy without the constant anxiety of parameter decay. It serves as an exceptionally reliable tactical overlay, capturing commodity upside during inflationary booms while preserving capital during deflationary busts.
Author: Cyril Dujava, Senior Quant Analyst, Quantpedia
Are you looking for more strategies to read about? Sign up for our newsletter or visit our Blog or Screener.
Do you want to learn more about Quantpedia Premium service? Check how Quantpedia works, our mission and Premium pricing offer.
Do you want to learn more about Quantpedia Pro service? Check its description, watch videos, review reporting capabilities and visit our pricing offer.
Do you want algorithmic access to the full Quantpedia database via the API? Subscribe to Quantpedia Pro, ask for an API key, and explore the in/out-of-sample statistics, source academic papers, and code snippets — ideal for quantitative research, systematic trading workflows, and AI model training.
Are you looking for historical data or backtesting platforms? Check our list of Algo Trading Discounts.
Or follow us on:
Facebook Group, Facebook Page, Telegram, Twitter, Linkedin, Medium or Youtube
References
- Antonacci, G. (2014). Dual Momentum Investing: An Innovative Strategy for Higher Returns and Lower Risk. McGraw-Hill Education.
- Jegadeesh, N., & Titman, S. (1993). Returns to Buying Winners and Selling Losers: Implications for Stock Market Efficiency. The Journal of Finance, 48(1), 65-91.
- Moskowitz, T. J., Ooi, Y. H., & Pedersen, L. H. (2012). Time Series Momentum. Journal of Financial Economics, 104(2), 228-250.
- Quantpedia. (2024). Pragmatic Asset Allocation Model for Semi-Active Investors. Retrieved from quantpedia.com
- Quantpedia. (2025). Active Dual Momentum GTAA Strategy. Retrieved from quantpedia.com


