Guardrails Make the Researcher: What an AI Agent Got Right (And Wrong) Replicating Nine Equity Anomalies
An autonomous research agent replicated nine published US-equity anomalies on clean, survivorship-free data. The question is not only what it found (out-of-sample decay is the rule, and on a faithful build none survive — the lone apparent survivor turned out to be a construction error the discipline caught) but whether you can trust an agent to find it, and the checks that decide the answer.
Can an agent actually do quant research?
Behind the AI hype sits a fair question: can a language model actually do quant research, or only sound like it can? We answered it on the one task this audience knows cold. We gave an autonomous research agent nine published US-equity anomalies and survivorship-free data and told it to work out which ones are real. Replication is the right proving ground precisely because the honest answer is usually disappointing and well documented: most published anomalies fade once tested on data the original study never saw, so an agent cannot hide behind a lucky result. The question worth asking is not whether it can run a backtest. It is whether it can run one we would trust, and whether it knows when it is fooling itself.
So the study has two layers. The quant layer asks of each paper: does the documented effect reproduce on clean data, and if it does, is it worth trading? The agent layer asks: where does the agent go wrong, and what catches the error before a wrong answer ships? We gave it a survivorship-free Core US Equities dataset: daily split- and dividend-adjusted prices alongside as-traded prices, 1998 to 2025, covering about 30,000 active and 31,000 delisted tickers. The survivorship-free property comes from retaining delisted names, so a strategy only ever holds names that were actually listed on the formation date. Where a paper trades the index (Hill) we reconstruct point-in-time S&P 500 membership, and the screens that need fundamentals draw on quarterly point-in-time data.
A word on who did what, because it shapes how to read the rest. We set the questions and the bar: we chose the papers, fixed the methodological priors (a survivorship-free universe, a rolling liquid cross-section, a 2023-onward regime break for the out-of-sample), and locked the in-sample and out-of-sample windows, the cost assumptions, and the viability gates before any result was read. Everything between those endpoints (reading each paper, building the universe and the signal, designing the data ingestion, running the backtests, the factor decompositions, and a first draft of this write-up) was done by the agent. We re-ran the leading candidates on a second, independent engine, and we edited the draft you are reading. The mistakes below are the agent’s too. They are also the point: an autonomous researcher is only as trustworthy as the checks that catch it.
How the agent works, and how it checks itself
The agent runs each paper through a fixed pipeline: fetch the paper, extract its strategy into an explicit specification, translate that specification into backtest code, run it, and review the result. The review is the part that matters, and it runs as two independent passes. A code-fidelity pass re-reads the generated code against the extracted specification and asks whether the assets, entry and exit logic, rebalance schedule, and fees actually match, watching for silent deviations like an off-by-one lookback or a wrong rebalance day. An execution-fidelity pass ignores the code and reads the trade log instead: the actual fills, the trade statistics, the failed-data requests, and the error log. It asks a blunter question. Does the strategy trade the way the paper says it should? Zero trades despite entry logic, far too few or too many trades for the stated schedule, fills at the wrong time of day, a relevant ticker silently missing its data: these are bugs code review alone cannot see. When either pass flags a major deviation the strategy goes back for a fix and re-runs. Most of what follows are failures these two passes caught, and they sort into two families: getting the strategy out of the paper, and getting it into code. Some of these checks the agent ran on its own; others we hardened after catching a miss ourselves. Either way, what we trust is the discipline, not the agent’s first answer.
Reading the paper, not the abstract
The agent’s first instinct was to build a strategy from a paper’s abstract and get moving. That is exactly how a fast, confident researcher gets things wrong, and it did.
On Arendarski’s “falling knives” study it built a momentum strategy, when the paper is explicitly contrarian: it buys stocks down 50% or more versus the market over the prior 500 trading days, not recent winners. On the same paper it applied a $5 price floor (a sensible default borrowed from another study) where the paper specifies $0.50, a difference that would have removed a large share of the very names the strategy is about and biased the book toward larger caps. More than once it guessed a paper’s universe from the title rather than from the page that defines it.
None of these are subtle once you look; all are invisible if you do not. The fix was a process change, not a smarter prompt. Before any backtest, the agent now writes a dossier card for each paper that quotes, verbatim, the paper’s own definition of its universe, signal, and screens, and the extraction is checked against those quotes. This is our most direct answer to the obvious objection, how do you know it isn’t hallucinating a replication? It can read fast, but it cannot trade a paraphrase.
Translating the strategy into code that trades as intended
A faithful extraction can still become unfaithful code, and faithful code can still trade in ways the paper never intended. The two review passes target both.
Code review caught the cleanest logic error in the batch. Frazzini and Pedersen’s betting-against-beta factor levers the low-beta long leg up toward the market’s beta; on our data that construction was degenerate, because 153 of 276 months contained near-zero-beta names that levered the leg toward near-infinite exposure. Reading the code against the specification made the problem plain, and we fell back to the tradeable long-only low-beta sleeve, declaring the deviation rather than shipping an exploded backtest.
Trade-log review caught the bugs no amount of code-reading would surface. An early run scheduled its universe refresh at the start of each year and quietly traded nothing until the second year, because the schedule skipped the start date; the empty first year showed up in the fills, not the code. A 500-name daily-rebalanced strategy generated orders in the millions before we gated rebalancing to month-rolls and active-set changes, cutting it to about 20,000 over 26 years, a trade-frequency problem visible only in the log. And a stock that delisted on the last trading day of 1999 but still sat in the January-2000 index snapshot failed its data request outright, a hard no-data rejection, until we pre-filtered the universe to names with real price history. One more discipline belongs here: we stopped trusting the engine’s headline statistics. Every Sharpe, return, and drawdown in this study is recomputed from the equity curve on one stated convention, and every promising result is re-run on a second, independent engine before we believe it.
Point-in-time, or it’s fiction
The most instructive result in the study also justifies the whole clean-data exercise, and it is a methodological demonstration of our own. The well-known “low-price anomaly” (cheap-nominal-price stocks outperform) is, Geertsema and Lu show, not a stable effect at all: under modern value-weighted, NYSE-breakpoint portfolio formation it is concentrated in tiny stocks and flips sign across eras. We asked a sharper question, why can a price-level sort look predictive when it isn’t, and isolated one concrete mechanism: look-ahead bias from the price field itself. Sort on retroactively split-adjusted prices and you bake in splits that had not happened yet; on the as-traded price an investor actually saw, the apparent edge should vanish. This is look-ahead bias from a price field, not survivorship bias, and we test it directly rather than assert it.
It vanishes. The agent ran the same low-minus-high-price long/short sort both ways. Figure 1 shows the two equity curves: the look-ahead version compounds to roughly 500x while the correct, as-traded version decays toward zero. The gap is pure illusion, about three and a half Sharpe points of “edge” out-of-sample, manufactured by one careless price field, because a low split-adjusted price today quietly flags a stock that will split, which is typically a past winner.
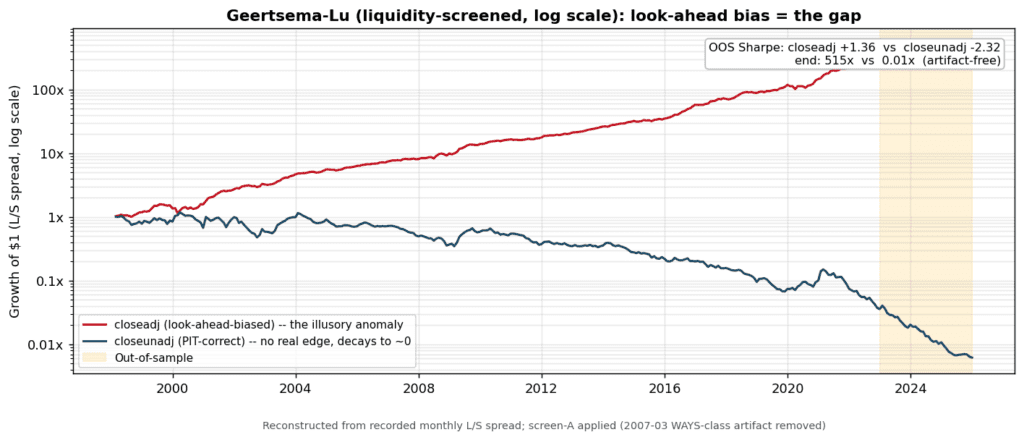
Figure 1. Growth of $1 (log scale) for the low-minus-high-price long/short sort, run on as-traded prices (correct) versus retroactively split-adjusted prices (look-ahead). IS = in-sample; OOS = out-of-sample (shaded). The distance between the lines is the bias.
The lesson generalizes to any signal computed on price levels (proximity to a 52-week high, RSI, nominal price), so the agent sorts every level-based signal on as-traded prices. Point-in-time data is not a nicety here. It is the difference between a real anomaly and an imaginary one.
Tradeability and costs
A backtest can be faithful to a paper and still describe a portfolio no one could own. Two defenses guard against that.
The first is a tradeability screen, and we learned why the hard way. In an early reconstruction of Bali, Cakici and Whitelaw’s “lottery” anomaly, a single halted micro-cap (its price frozen for weeks, then a corrupt print) produced a +76% month for the whole basket and inflated the 27-year curve from about 16x to about 38x. Worse, the strategy selects such names on purpose: a frozen price looks like the calmest stock in the cross-section and lands in the long book. A point-in-time liquidity and stale-price screen, plus value-weighting (the paper’s own convention), cut that artifact month to +0.1% and left the verdict intact but the magnitude honest. The agent now applies that screen to every broad-universe sort and scans each return series for single-month outliers before trusting a curve.
The second defense is realistic, turnover-aware costs. A market-neutral reversal book can reconstitute almost completely every month, on the order of 2,200% annual turnover, so it looks superb at a flat paper-comparison cost and ordinary once you charge realistic, liquidity-tiered costs with borrow on the short leg. We cost-stress every candidate on its measured turnover and report a break-even cost, because a Sharpe that exists only at zero cost is not a result. Our one apparent survivor was eventually undone by a more basic flaw than its costs (next section), but high turnover into an illiquid short book is exactly the microstructure constraint these screens exist to surface.
What the checks produced
Run through all of this, the nine anomalies thin out fast, and out-of-sample, to nothing. Figure 2 is the whole study in one view: each paper’s in-sample alpha against its out-of-sample alpha, both as a market-adjusted t-statistic.
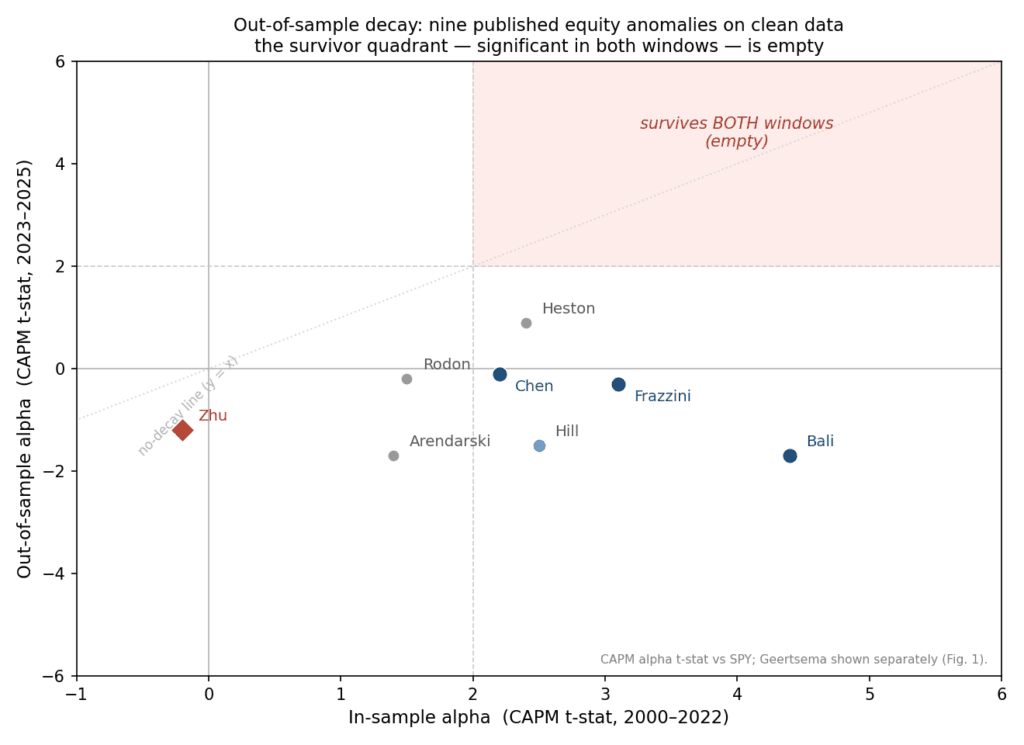
Figure 2. In-sample (2000–22) vs out-of-sample (2023–25) market-adjusted alpha, as a CAPM t-statistic vs SPY, for the nine anomalies (Geertsema shown separately in Figure 1 — it is a look-ahead demonstration, not a tradeable anomaly). The shaded box is the “survivor” quadrant: significant in both windows. It is empty. On full-sample alphas, three clear t > 2 (Bali, Frazzini, Chen) and only one (Bali) clears the stricter t > 3 multiple-testing hurdle the literature (Harvey, Liu & Zhu, 2016) demands; out-of-sample none clears either bar.
Two findings carry the piece. Decay is the rule, not the exception: all three of the historically real effects (Bali, Frazzini, Chen) faded to insignificance, or reversed, over our 2023-to-2025 out-of-sample window. We measure this against a single fixed out-of-sample date, not from each paper’s own publication year, but it is the same fading the post-publication-decay literature (McLean & Pontiff, 2016) would predict. Nothing long-only beat passive: the out-of-sample regime was a narrow mega-cap rally in which SPY returned about 22.9% a year at a Sharpe of 1.43 and an 18.8% drawdown, and no long-only anomaly matched it on return or risk-adjusted return. The benchmark, not the signals, dominated.
And the finding that nearly fooled us: there was, in our first pass, a survivor, a market-neutral long/short with an out-of-sample Sharpe of 1.95. It did not survive a closer look, and how it failed is the sharpest lesson in this study.
That strategy was Zhu, Sun and Stivers’s 52-week-high-and-short-term-reversal long/short. When we checked our build against the paper, the two did not match, and not at the margins. The paper’s strategy is a one-month return reversal run within the low-52-week-high quintile, value-weighted: both legs are stocks far from their highs, long the recent losers, short the recent winners. What we had built was a blended corner-sort: long stocks near their highs that had pulled back, short stocks far from theirs that had popped, equal-weighted. Our long leg sat in exactly the high-52-week-high names the paper shows have essentially no reversal.
Rebuilt faithfully (value-weighted, reversal within the low quintile, raw returns, the 52-week high measured the month before) the result inverts. In-sample the alpha is insignificant on the paper’s value-weighting; out-of-sample it is significantly negative, because the strategy shorts recent winners that kept rising through the 2023–25 rally. The 1.95 was never Zhu’s strategy at all; it was an artifact of the mis-construction, the equal-weighting and the corner-sort each inflating it a different way.
So the survivor does not survive, and that is the sharpest entry in our error taxonomy. The agent’s unverified construction did not merely misstate a number; it manufactured the study’s entire positive finding, and only checking the build against the source paper caught it. (One honest limit: our data starts in 1998, so this is a faithful build on our window, not a test of whether Zhu’s published 1967–2015 reversal ever existed.) On clean data, faithfully built, none of the nine survive out-of-sample.
One discipline held throughout: at 36 out-of-sample months, across the full set of correlated cells we evaluated, no single result is significant after correcting for the number of strategies tested. Everything above rests on structural evidence (independent-engine validation, factor decomposition, full-sample estimates), not on out-of-sample significance, and we say so wherever it matters.
So, can you trust the agent?
It got real things right. It built and ran the pipeline end to end, reproduced the faithful replications without inflating them, produced numbers that held when the leading candidates were re-run on a second engine, and pinned the look-ahead illusion to a single price field. Still, on this batch the honest answer is: trust the guardrails, not the agent. Left alone it would have traded paraphrases of the papers, shipped a degenerate portfolio, and quoted the engine’s flattering Sharpe. Fenced by the two-pass fidelity review, the point-in-time discipline, and the tradeability and cost screens, it produced a result we are willing to stand behind: on clean data, with honest costs and a real multiple-testing hurdle, published equity anomalies mostly do not survive to be tradeable, and on this batch, faithfully built, none did out-of-sample. The one that appeared to was the agent’s own construction error, caught only by checking the build against the source paper. That is close to the base rate a careful human team would expect, which is the point. The value of an LLM-driven pipeline here is not that it backtests faster. It is that, fenced correctly, it can compress a literature into a defensible finding and show its work, including its mistakes.
The claim still needs a harder test, and we know which one. A blind benchmark: hand the agent a set of papers with known internal replication outcomes, withhold the ground truth, and score whether it tells replicable from non-replicable. That turns the pipeline from a producer of results into a measurable instrument, which is the only way “it didn’t hallucinate this one” becomes a number rather than a promise. For readers who want the full evidence (every paper at equal depth, the complete in-sample and out-of-sample metric table, the factor decompositions, and the per-paper notes on what worked and what broke), the long-form report is linked as an appendix.
Author: Vlad Rodeski builds AI agents that research, test, and validate quantitative trading strategies, which he publishes as PolyQuant. Before that he was an allocator to crypto quant teams and chief investment officer of a crypto fund of funds, running due diligence on strategy, execution, and risk. He writes about AI-driven trading research at polyquantai.com. Reach him at vlad@polyquantai.com or linkedin.com/in/vladrodeski. Have a trading idea, a signal, a strategy, a paper you believe in? Send it and the agent will tell you what’s likely wrong with it. If you like how that conversation goes, let’s talk.
Reviewed and advised by Radovan Vojtko, CEO and Head of Research at Quantpedia. The full long-form report is at polyquantai.com/research/equity-anomalies-replication: every paper at equal depth, the complete in-sample and out-of-sample metric tables, the factor decompositions, and the per-paper notes.
Are you looking for more strategies to read about? Sign up for our newsletter or visit our Blog or Screener.
Do you want to learn more about Quantpedia Premium service? Check how Quantpedia works, our mission and Premium pricing offer.
Do you want to learn more about Quantpedia Pro service? Check its description, watch videos, review reporting capabilities and visit our pricing offer.
Do you want algorithmic access to the full Quantpedia database via the API? Subscribe to Quantpedia Pro, ask for an API key, and explore the in/out-of-sample statistics, source academic papers, and code snippets — ideal for quantitative research, systematic trading workflows, and AI model training.
Are you looking for historical data or backtesting platforms? Check our list of Algo Trading Discounts.
Or follow us on:
Facebook Group, Facebook Page, Telegram, Twitter, Linkedin, Medium or Youtube
Papers replicated
The nine US-equity papers evaluated in this study, in order of appearance:
- Hill, Finding Consistent Trends with Strong Momentum: RSI for Trend-Following and Momentum Strategies (2019). SSRN 3412429.
- Zhu, Sun & Stivers, Price Anchors and Short-Term Reversals. Financial Management (2021). SSRN 3092325.
- Bali, Cakici & Whitelaw, Maxing Out: Stocks as Lotteries and the Cross-Section of Expected Returns. Journal of Financial Economics (2011). NBER w14804.
- Frazzini & Pedersen, Betting Against Beta. Journal of Financial Economics (2014). Stern PDF.
- Arendarski, Tactical Allocation in Falling Stocks: Combining Momentum and Solvency Ratio Signals. WNE Working Paper No. 1/2012 (67), University of Warsaw (2012). WNE WP67.
- Rodon Comas, Winners & Losers in Motion: A Market-State Momentum Signal (2025). SSRN 5130289.
- Chen, Persistency of the Momentum Effect (2016). SSRN 2652592.
- Heston & Sadka, Seasonality in the Cross-Section of Expected Stock Returns. Journal of Financial Economics (2008). SSRN 687022.
- Geertsema & Lu, Revisiting the Price Effect in US Stocks. SSRN 4013958.
Share onLinkedInTwitterFacebookRefer to a friend


