Silicon vs. Satoshi: Tactical Asset Rotation Between NASDAQ-100 and Bitcoin
Abstract
We investigate a Donchian breakout rotation strategy between QQQ (NASDAQ-100) and Bitcoin (BTC), with a cash fallback during consolidation, and test it across eight lookback horizons (5–50 trading days) and two priority variants over a seven-year sample spanning 2019–2026. The strategy consistently outperforms passive benchmarks on a risk-adjusted basis, achieving Sharpe ratios up to 1.69, Calmar ratios exceeding 2.2, and maximum drawdowns compressed by 50–79% relative to buy-and-hold allocations. Results are robust across the 5–30 day lookback range, demonstrating that retail attention dynamics between technology stocks and cryptocurrency represent exploitable structure amenable to systematic harvesting.
1. Introduction
1.1 Background
Bitcoin and the NASDAQ-100 technology sector are economic substitutes in the retail attention marketplace. Both draw from the same finite pool of risk appetite, speculative capital, and cognitive bandwidth that characterizes the individual investor (Barber & Odean, 2000). The QQQ ETF, tracking the NASDAQ-100, has undergone a profound transformation since the public release of large language models in late 2022. The so-called “Magnificent Seven”—Apple, Microsoft, NVIDIA, Alphabet, Amazon, Meta Platforms, and Tesla—have collectively driven an outsized share of the index’s returns, powered principally by the artificial intelligence narrative. NVIDIA alone, the dominant supplier of GPU hardware for AI training and inference, has seen its market capitalization grow by more than an order of magnitude between 2023 and 2025. Bitcoin, meanwhile, remains an asset defined by extreme trend persistence and violent mean reversion—extended bull runs interspersed with brutal drawdowns that can erase 50–80% of peak value. The approval of spot Bitcoin ETFs in January 2024, most notably the iShares Bitcoin Trust (IBIT), provided institutional-grade access to Bitcoin exposure and fundamentally changed the feasibility calculus for systematic strategies. In the current bull market, both asset classes capture the attention of the retail crowd through the same psychological mechanisms: FOMO, herding behavior, recency bias, and overconfidence. The asset that is currently breaking out to new highs captures a disproportionate share of the marginal retail dollar.
1.2 Theoretical Underpinnings and Motivation
The intellectual foundations rest on three pillars. Liu and Tsyvinski (2021) establish that cryptocurrency returns exhibit a strong time-series momentum effect and that proxies for investor attention significantly forecast future returns—implying that retail attention allocation is a priced factor in crypto markets. Barber and Odean (2000) demonstrate that individual investors are systematically overconfident, trade excessively, and pay a performance penalty—suggesting that a rules-based approach can harvest the alpha that behavioral biases inject into favored assets. Moskowitz, Ooi, and Pedersen (2012) document significant time-series momentum across 58 liquid instruments, finding return persistence over one to twelve months that partially reverses at longer horizons—consistent with sentiment theories of initial under-reaction followed by delayed over-reaction. The practical motivation extends from recent work on trend-following in Bitcoin. Padyšák and Vojtko (2022) find that “BTC tends to trend when it is at its maximum and bounce back when at the minimum,” while Beluská and Vojtko (2024) confirm these strategies remain viable across multiple regimes through August 2024. Vojtko and Dujava (2026) construct a systematic dual-momentum framework comparing Bitcoin and physical gold (GLD), establishing the data pipeline methodology we adapt here: raw BTC/USD price data from the Bitfinex exchange (hourly bars) resampled into a continuous series aligned with the paired equity asset’s trading calendar, ensuring session-aligned, point-in-time consistency. Our contribution is to shift the pairing from gold to technology and to introduce a three-state rotation framework (asset A → asset B → cash) with explicit priority ordering.
2. Data
The Invesco QQQ Trust (QQQ) is selected as the representative instrument for technology equity exposure. QQQ tracks the NASDAQ-100 Index, heavily weighted toward large-cap technology companies, including the “Magnificent Seven,” and is chosen for its exceptional liquidity and status as the de facto instrument for retail investors seeking technology sector exposure. Data is sourced via EODHD.com – the sponsor of our blog (and as a special offer, our blog readers can enjoy an exclusive 30% discount on premium EODHD plans).
Bitcoin exposure is captured through the iShares Bitcoin Trust (IBIT), which replaced its previous tracking vehicle, the ProShares Bitcoin Strategy ETF (BITO), following the introduction of spot Bitcoin ETFs in January 2024, due to IBIT’s robust liquidity profile. Raw BTC/USD price data is sourced from the Bitfinex exchange (hourly bars), resampled into a continuous series aligned with QQQ’s data sample. Before merging, we screen QQQ for valid NASDAQ trading days, then match each selected QQQ observation to its contemporaneous Bitcoin timestamp. The raw Bitcoin dataset is filtered strictly for QQQ closing times—this serves as the definitive settlement price of Bitcoin and ensures session-aligned, point-in-time consistency across the paired time series.
The data sample spans 2019-01-01 through 2025-12-31 (seven calendar years), encompassing the COVID-19 crash (trough 2020-03-23), the subsequent bull market through November 2021, the crypto winter of 2022–2023 (including the Terra/Luna collapse of 2022-05-09 and FTX bankruptcy of 2022-11-11), and the AI-driven renaissance of 2023–2026. Return series are computed as simple percentage changes: rt = (Pt / Pt−1) − 1. Since Bitcoin trades continuously while QQQ trades on NASDAQ business days, the effective sample calendar is governed by QQQ’s trading calendar.
3. Methods, Models, and Approaches
3.1 Hypothesis
H1: Is it possible to achieve more attractive risk-adjusted performance relative to passive benchmarks through semi-active, breakout-based tactical rotation between QQQ and Bitcoin, incorporating a cash fallback during consolidation?
This hypothesis is grounded in the conjunction of time-series momentum in both Bitcoin and equity indices, the behavioral tendency of retail investors to chase breakout momentum, and the empirical success of price channel breakout strategies documented by Brock, Lakonishok, and LeBaron (1992).
3.2 Signal Construction
The core signal mechanism employs a Donchian-style price channel breakout. For a given lookback window w and asset price series P, the upper channel bound at time t is defined as Ut(w) = max(Pt−w, Pt−w+1, …, Pt−1). A breakout signal is triggered when the current closing price exceeds this bound.
The strategy employs a three-state rotation among QQQ, BTC, and cash. Two variants are tested: Variant A (QQQ → BTC → Cash) grants QQQ first priority, then checks BTC for breakout; Variant B (BTC → QQQ → Cash) grants Bitcoin first priority, then checks QQQ. If neither asset is in a breakout, both strategies retreats to 100% cash (earning 0%).
3.3 Performance Metrics and Assumptions
Performance is evaluated using CAGR, annualized volatility (σdaily × √252), Sharpe ratio, maximum drawdown, and Calmar ratio—all on a 252-trading-day annualization basis. The risk-free rate is modeled at 0%; transaction costs are not modeled. Lookback periods tested are 5, 10, 15, 20, 25, 30, 40, and 50 trading days. Benchmarks include a 50/50 equally-weighted portfolio (daily return rt = 0.5 × rBTC,t + 0.5 × rQQQ,t, equivalent to a buy-and-hold allocation rebalanced to equal weight at inception), as well as 100% QQQ and 100% BTC buy-and-hold allocations.
4. Results
4.1 Variant A: QQQ → BTC → Cash Priority
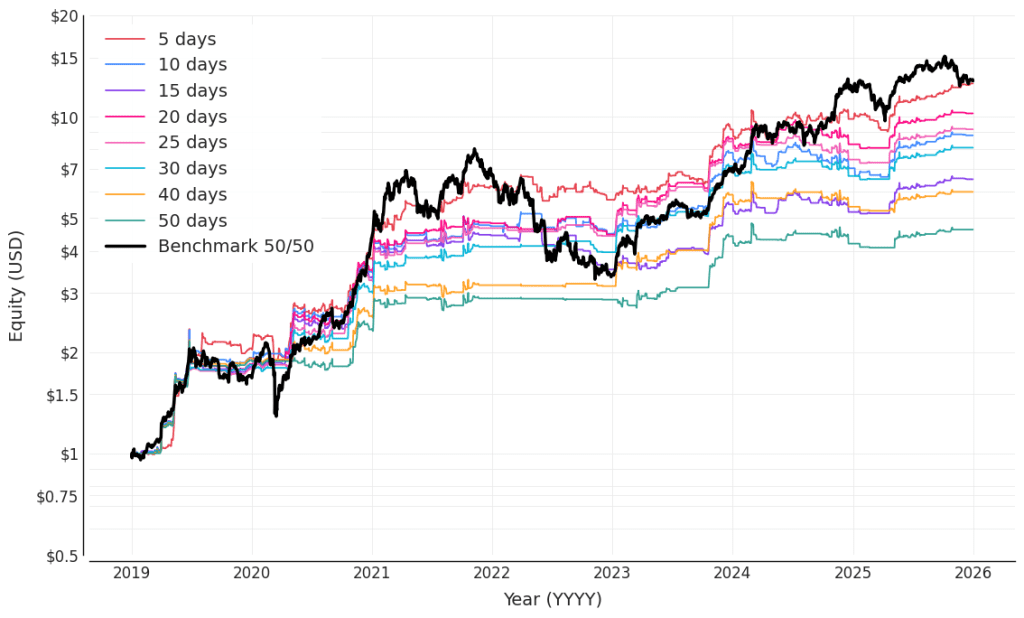
Figure 1. Equity curves for Variant A across all eight look-back horizons (5–50 days), plotted on a logarithmic scale. The black line represents the 50/50 equally-weighted benchmark portfolio.
| Strategy / Benchmark | CAGR | Ann. Vol. | Sharpe | Max DD | Calmar |
|---|---|---|---|---|---|
| 5-Day | 43.69% | 25.85% | 1.690 | −19.51% | 2.240 |
| 10-Day | 36.56% | 24.05% | 1.520 | −22.52% | 1.623 |
| 15-Day | 30.82% | 23.83% | 1.293 | −26.61% | 1.158 |
| 20-Day | 39.53% | 23.53% | 1.680 | −17.59% | 2.247 |
| 25-Day | 37.38% | 23.29% | 1.605 | −21.11% | 1.771 |
| 30-Day | 34.93% | 22.93% | 1.523 | −16.48% | 2.120 |
| 40-Day | 29.21% | 22.02% | 1.327 | −18.85% | 1.550 |
| 50-Day | 24.52% | 21.35% | 1.148 | −17.87% | 1.373 |
| Benchmark 50/50 | 44.05% | 37.07% | 1.188 | −59.03% | 0.746 |
| Benchmark 100% QQQ | 21.82% | 24.22% | 0.901 | −35.62% | 0.613 |
| Benchmark 100% BTC | 55.90% | 62.57% | 0.894 | −76.63% | 0.730 |
Table 1. Performance metrics for Variant A (QQQ → BTC → Cash), January 2019–December 2025.
Seven of eight variants achieve Sharpe ratios above 1.29, with the 5-day (1.69) and 20-day (1.68) variants approaching 1.7. The 20-day variant combines a 39.53% CAGR, a 23.53% volatility, and the highest Calmar ratio (2.247); the 30-day variant achieves the shallowest maximum drawdown (−16.48%). In contrast, the 50/50 benchmark suffers a −59.03% drawdown, and 100% BTC endures a −76.63% drawdown—despite posting the highest raw CAGR (55.90%).
4.2 Variant B: BTC → QQQ → Cash Priority
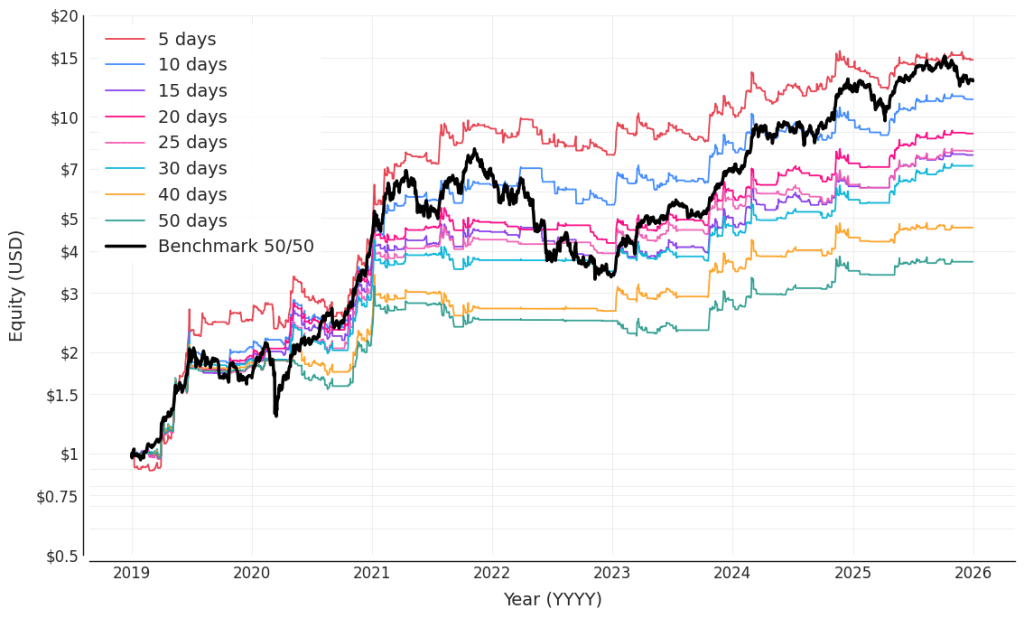
Figure 2. Equity curves for Variant B across all eight look-back horizons (5–50 days), plotted on a logarithmic scale. The black line represents the 50/50 equally-weighted benchmark portfolio.
| Strategy / Benchmark | CAGR | Ann. Vol. | Sharpe | Max DD | Calmar |
|---|---|---|---|---|---|
| 5-Day | 47.06% | 33.11% | 1.422 | −23.94% | 1.966 |
| 10-Day | 41.48% | 29.68% | 1.398 | −22.79% | 1.820 |
| 15-Day | 33.96% | 27.70% | 1.226 | −28.84% | 1.178 |
| 20-Day | 36.80% | 26.87% | 1.370 | −21.45% | 1.716 |
| 25-Day | 34.48% | 26.47% | 1.302 | −17.98% | 1.918 |
| 30-Day | 32.56% | 26.03% | 1.251 | −19.16% | 1.700 |
| 40-Day | 24.76% | 25.02% | 0.990 | −24.41% | 1.014 |
| 50-Day | 20.66% | 24.42% | 0.846 | −28.88% | 0.715 |
| Benchmark 50/50 | 44.05% | 37.07% | 1.188 | −59.03% | 0.746 |
| Benchmark 100% QQQ | 21.82% | 24.22% | 0.901 | −35.62% | 0.613 |
| Benchmark 100% BTC | 55.90% | 62.57% | 0.894 | −76.63% | 0.730 |
Table 2. Performance metrics for Variant B (BTC → QQQ → Cash), January 2019–December 2025.
Granting Bitcoin first priority produces higher absolute returns at short lookbacks (5-day: 47.06% CAGR, the highest across all configurations) but elevated volatility (33.11%). All variants from 5-day through 30-day achieve Sharpe ratios above 1.2, with the 25-day variant offering the best drawdown profile (−17.98%) and an impressive Calmar of 1.92. The 50-day variant degrades to a Sharpe ratio of 0.846—below all benchmarks—indicating that the Bitcoin-first ordering is less robust over longer horizons.
5. Discussion & Conclusion
The breakout rotation strategy consistently outperforms passive benchmarks on a risk-adjusted basis across the overwhelming majority of tested configurations. While 100% BTC achieves the highest raw CAGR (55.90%), it comes at the cost of 62.57% annualized volatility and a catastrophic maximum drawdown of −76.63%. The 50/50 benchmark similarly declines by 59.03%. In contrast, the rotation strategies achieve maximum drawdowns of −16.48% to −28.88%—representing a 51–79% reduction relative to the passive benchmarks. This drawdown compression is the structural signature of the cash fallback mechanism: by retreating to cash during consolidation, the strategy avoids participation in the sharp drawdowns that characterize both asset classes.
The 5-day through 30-day lookback range produces the strongest risk-adjusted results, with the 20-day and 25-day horizons offering the best balance of Sharpe ratio (1.30–1.68), CAGR (34–40%), and drawdown control (−17% to −21%). Longer lookbacks (40–50 days) deteriorate, particularly under Variant B. The parameter space exhibits a robust plateau across the 5–30 day range, suggesting that the strategy’s efficacy is not an artifact of data snooping.
For the practitioner, we recommend diversifying across lookback horizons—averaging signals from the 10, 20, and 30-day variants—to mitigate parameter sensitivity. This mirrors the ensemble methodology in machine learning, where averaging across weak learners produces a stronger aggregate predictor. Variant A (QQQ-first) is superior on a risk-adjusted basis: higher Sharpe ratios, lower volatility, shallower drawdowns. Variant B (BTC-first) is superior in absolute return over short horizons and is preferred by practitioners with a greater tolerance for drawdowns. The strategy is implementable with minimal infrastructure—daily closing prices, a rolling maximum, and a conditional allocation rule—and is compatible with standard brokerage accounts. The ultimate lesson is disarmingly simple: let the trend tell you where to be, and let the absence of a trend tell you when to step aside.
Several limitations warrant acknowledgment. Transaction costs are not modeled, while the low-frequency nature suggests a modest real-world drag; precise quantification requires venue-specific data. The strategy is long-only with no leverage. The seven-year sample, while spanning multiple regimes, remains relatively short by traditional asset pricing standards. The 0% risk-free rate understates the true opportunity cost of cash in a positive-rate environment (2022–2025), thereby modestly reducing reported Sharpe ratios without altering qualitative conclusions.
Author: Cyril Dujava, Senior Quant Analyst, Quantpedia
Are you looking for more strategies to read about? Sign up for our newsletter or visit our Blog or Screener.
Do you want to learn more about Quantpedia Premium service? Check how Quantpedia works, our mission and Premium pricing offer.
Do you want to learn more about Quantpedia Pro service? Check its description, watch videos, review reporting capabilities and visit our pricing offer.
Do you want algorithmic access to the full Quantpedia database via the API? Subscribe to Quantpedia Pro, ask for an API key, and explore the in/out-of-sample statistics, source academic papers, and code snippets — ideal for quantitative research, systematic trading workflows, and AI model training.
Are you looking for historical data or backtesting platforms? Check our list of Algo Trading Discounts.
Or follow us on:
Facebook Group, Facebook Page, Telegram, Twitter, Linkedin, Medium or Youtube
References
Barber, B. M., & Odean, T. (2000). Trading is hazardous to your wealth: The common stock investment performance of individual investors. The Journal of Finance, 55(2), 773–806. https://doi.org/10.1111/0022-1082.00226
Beluská, S., & Vojtko, R. (2024). Revisiting trend-following and mean-reversion strategies in Bitcoin. Available at SSRN. https://ssrn.com/abstract=4955617
Brock, W., Lakonishok, J., & LeBaron, B. (1992). Simple technical trading rules and the stochastic properties of stock returns. The Journal of Finance, 47(5), 1731–1764. https://doi.org/10.1111/j.1540-6261.1992.tb04681.x
Liu, Y., & Tsyvinski, A. (2021). Risks and returns of cryptocurrency. The Review of Financial Studies, 34(6), 2689–2727. https://doi.org/10.1093/rfs/hhaa113
Moskowitz, T. J., Ooi, Y. H., & Pedersen, L. H. (2012). Time series momentum. Journal of Financial Economics, 104(2), 228–250. https://doi.org/10.1016/j.jfineco.2011.11.003
Padyšák, M., & Vojtko, R. (2022). Seasonality, trend-following, and mean reversion in Bitcoin. Available at SSRN. https://ssrn.com/abstract=4081000
Quantpedia. (2022). Trend-following and mean reversion in Bitcoin. https://quantpedia.com/trend-following-and-mean-reversion-in-bitcoin/
Quantpedia. (2024). Revisiting trend-following and mean-reversion strategies in Bitcoin. https://quantpedia.com/revisiting-trend-following-and-mean-reversion-strategies-in-bitcoin/
Quantpedia. (2026). Dual momentum allocation between physical gold and Bitcoin (digital gold). https://quantpedia.com/dual-momentum-allocation-between-physical-gold-and-bitcoin-digital-gold/
Vojtko, R., & Dujava, C. (2026). Dual momentum allocation between physical gold and Bitcoin (digital gold). Available at SSRN. https://ssrn.com/abstract=6729918


