Two Centuries of Global Factor Premiums

7.March 2019

Related to all major factor strategies (trend, momentum, value, carry, seasonality and low beta/volatility):

Authors: Baltussen, Swinkels, van Vliet

Title: Global Factor Premiums

Link: https://papers.ssrn.com/sol3/papers.cfm?abstract_id=3325720

Abstract:

We examine 24 global factor premiums across the main asset classes via replication and new-sample evidence spanning more than 200 years of data. Replication yields ambiguous evidence within a unified testing framework with methods that account for p-hacking. The new-sample evidence reveals that the large majority of global factors are strongly present under conservative p-hacking perspectives, with limited out-of-sample decay of the premiums. Further, utilizing our deep sample, we find global factor premiums to be not driven by market, downside, or macroeconomic risks. These results reveal strong global factor premiums that present a challenge to asset pricing theories.

Notable quotations from the academic research paper:

"In this paper we study global factors premiums over a long and wide sample spanning the recent 217 years across equity index (but not single securities), bond, currency, and commodity markets.

The first objective of this study is to robustly and rigorously examine these global factor premiums from the perspective of ‘p-hacking’.

We take as our starting point the main global return factors published in the Journal of Finance and the Journal of Financial Economics during the period 2012-2018: time-series momentum (henceforth ‘trend’), cross-sectional momentum (henceforth ‘momentum’), value, carry, return seasonality and betting-against-beta (henceforth ‘BAB’). We examine these global factors in four major asset classes: equity indices, government bonds, commodities and currencies, hence resulting in a total of 24 global return factors.4

We work from the idea that these published factor premiums could be influenced by p-hacking and that an extended sample period is useful for falsification or verification tests. Figure 1, Panel A summarizes the main results of these studies.
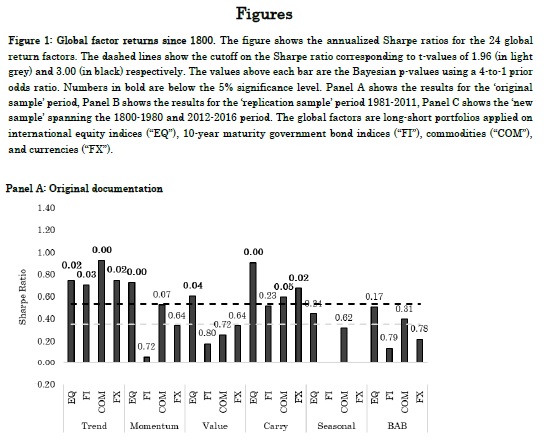
Global factor strategies

Shown are the reported Sharpe ratio’s in previous publications, as well as the 5% significance cutoff in the grey-colored dashed line. In general, the studies show evidence on the global factor premiums, with 14 of the 22 factors (return seasonality is not tested in bonds and currencies) displaying significant Sharpe ratio’s at the conventional 5% significance level.
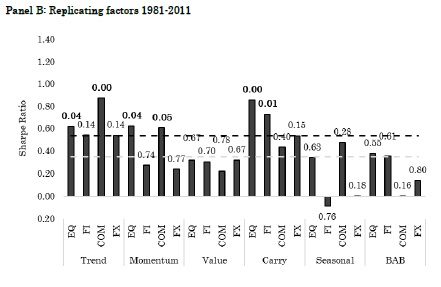
Global factor strategies 1981-20111

Further, most of the studies have differences in, amongst others, testing methodologies, investment universes and sample periods, choices that introduce degrees of freedom to the researcher. To mitigate the impact of such degrees of freedom, we reexamine the global return factors using uniform choices on testing methodology and investment universe over their average sample period (1981-2011). Figure 1, Panel B shows the results of this replicating exercise. We find that Sharpe ratios are marginally lower, with 12 of the 24 factor premiums being significant at the conventional 5% level.
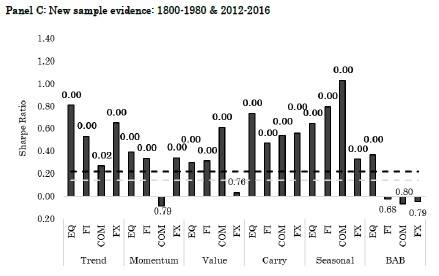
Global factor strategies 1981-2011


The second objective of this study is to provide rigorous new sample evidence on the global return factors. To this end, we construct a deep, largely uncovered historical global database on the global return factors in the four major asset classes. This data consists of pre-sample data spanning the period 1800- 1980, supplemented with post-sample data from 2012-2016, such that we have an extensive new sample to conduct further analyses. If the global return factors were unintentionally the result of p-hacking, we would expect them to disappear for this new sample period.

Our new sample findings reveal consistent and ubiquitous evidence for the large majority of global return factors. Figure 1, Panel C summarizes our main findings by depicting the historical Sharpe ratio’s in the new sample period. In terms of economic significance, the Sharpe ratios are substantial, with an average of 0.41. Remarkably, in contrast to most out-of-sample studies we see very limited ‘out-of-sample’ decay of factor premiums.

In terms of statistical significance and p-hacking perspectives, 19 of the 24 t-values are above 3.0,19 Bayesian p-values are below 5%, and the break-even prior odds generally need to be above 9,999 to have less than 5% probability that the null hypothesis is true."


Are you looking for more strategies to read about? Check http://quantpedia.com/Screener

Do you want to see performance of trading systems we described? Check http://quantpedia.com/Chart/Performance

Do you want to know more about us? Check http://quantpedia.com/Home/About


Follow us on:

Facebook: https://www.facebook.com/quantpedia/

Twitter: https://twitter.com/quantpedia


Continue reading

Fund Flows of Active Funds Significantly Affect Value and Size Factors

27.February 2019

A new academic paper related to:

#25 – Size Factor
#26 – Value (Book-to-Market) Factor

Authors: Hung, Song, Xiang

Title: Fragile Factor Premia

Link: https://papers.ssrn.com/sol3/papers.cfm?abstract_id=3312837

Abstract:

We demonstrate that returns and volatilities of the Fama-French size and value factors are significantly determined by non-fundamental flow-induced trading from actively managed equity mutual funds. Mutual fund flows are largely ignorant about systematic risks. These non-fundamental shifts in demand induce large return heterogeneity within and across the Fama-French size and book-to-market portfolios. We show that aggregate mutual fund flow- induced trades across the size and book-to-market spectrum significantly influence the size and value premia, followed by large subsequent reversals. We also find that the expected volatilities of mutual funds’ flow-induced trades strongly predict future factor volatilities. Our results highlight the importance of non-fundamental demand shocks in determining factor premia and factor volatilities.

Notable quotations from the academic research paper:

"Mutual fund trading has a considerable price impact on individual stocks. However, some more recent work suggests that mutual fund investors are largely ignorant about systematic risks, when allocating capitals among mutual funds. Empirically, it remains unclear how trades induced by the non-fundamental mutual fund flows impact returns and volatilities of size and value, the two prominent factors. This paper aims to fi ll this gap.

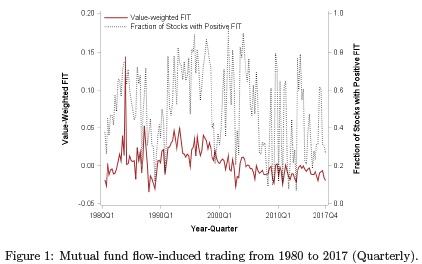
In our study, we use a bottom-up approach and estimate mutual fund flow-induced trading (FIT) for each stock-quarter from 1980 to 2017. In a nutshell, FIT measures the magnitude of flow-driven trading by the aggregate equity mutual fund industry on a particular stock in a given quarter. We use FIT rather than the entire realized trading of mutual funds because FIT only captures those trades that are driven by the demand shifts from mutual fund investors, which are largely ignorant about fundamentals

Fund flows

Our main fi ndings are as follows.

We fi nd that returns of the six FF size and book-to-market portfolios are largely determined by the uninformed mutual fund flow-induced trades. Within each of the six FF portfolios, stocks with higher FIT have higher return performance.

Mutual funds' flow-driven trades can even revert the positive size and value premia. That is, within the same book-to-market portfolios, we find large-cap stocks with above-median FIT outperform small-cap stocks with below-median FIT. Within the same size portfolios, growth stocks with above-median FIT outperform value stocks with below-median FIT.

Value & Size Factor

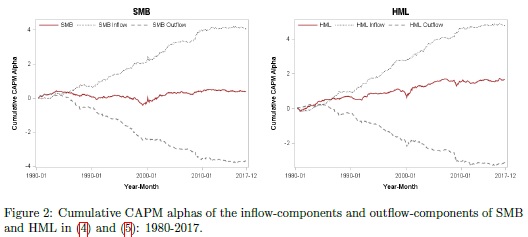
We decompose the value minus growth returns (HML) into two components: (i) value-inflow minus growth-outflow returns (HMLInflow) and (ii) value-outflow minus growth-inflow (HMLOutflow). We decompose the small minus big returns (SMB) into the sum of (i) small-inflow minus big-outflow returns (SMBInflow) and (ii) small-outflow minus big-inflow returns (SMBOutflow). Figure 2 report the average monthly returns and alphas of SMB, HML, and their inflow and outflow components.

In sum, we find that the size premium is due to the component of small-inflow stocks minus big-outflow stocks, while the value premium is due to the component of value-inflow stocks minus growth-outflow stocks."


Are you looking for more strategies to read about? Check http://quantpedia.com/Screener

Do you want to see performance of trading systems we described? Check http://quantpedia.com/Chart/Performance

Do you want to know more about us? Check http://quantpedia.com/Home/About


Follow us on:

Facebook: https://www.facebook.com/quantpedia/

Twitter: https://twitter.com/quantpedia


Continue reading

Why Is Allocation to Trend-Following Strategy So Low?

21.February 2019

Related to all trendfollowing strategies:

Authors: Dugan, Greyserman

Title: Skew and Trend Aversion

Link: https://papers.ssrn.com/sol3/papers.cfm?abstract_id=3315719

Abstract:

Despite evidence of the benefits to portfolio Sharpe ratio and variance, actual investor allocations to Trend Following strategies are typically 5% or less. Why is there such a significant discrepancy between the optimal allocation and actual allocation to Trend? We investigate known behavioral biases as a potential reason. While decision makers have other reasons to exclude Trend Following from their portfolios, in this paper, we explore loss aversion, recency bias, and the ambiguity effect as they pertain to Trend Following, and we call the combination of the three Trend Aversion. We quantify Trend Aversion and show that these biases are a viable explanation for suboptimal allocations to Trend. We demonstrate a direct connection between quantifications of known behavioral biases and current suboptimal allocations to Trend Following. Recognition of these relationships will help highlight the pitfalls of behavioral biases.

Notable quotations from the academic research paper:

"Investors may have reasons for excluding Trend Following from their portfolios ranging from time-horizon for performance, to drawdowns, to potential capacity issues. However, the strategy's long performance history shows that a meaningful allocation would have increased portfolio Sharpe ratio and reduced portfolio variance, and yet typical investments remain at or below 5%. Some investors have no exposure.

The strategy's quantitative nature, positive skew, and frequent but small losses act in concert to trigger loss aversion, recency bias, and the ambiguity e ffect. We call the combination of the three Trend Aversion.

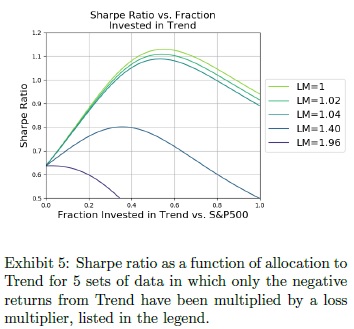
Sharpe ratio vs. Fraction invested in Trend


Our results show Trend Aversion is a viable explanation of suboptimal allocations to Trend Following. Decades of psychological research show that people mentally inflate losses by a factor of two. In this paper, we demonstrated that a loss multiplier between 1.5 and 2.5 would cause the typical allocation to Trend of 5% in a simple two asset portfolio, in an 11-asset portfolio with random allocations, and in two other 11-asset portfolio constructions with dynamic allocations. We showed that loss aversion can decrease allocators Sharpe ratios by up to 50%. Using lookback windows in a dynamically allocated portfolio, we demonstrated that recency bias drives down allocations to Trend. Finally, we showed that combinations of loss aversion and recency bias also drive Trend allocations to suboptimal levels.

Many investors who are subject to Trend Aversion as a practical matter, for example due to investment committees or reporting structures, are unsure of how to balance Trend Aversion with the bene ts of Trend Following to reach an allocation decision. By establishing a methodology to optimize allocations under loss aversion, we provide a framework which investors can use to formalize their allocation decisions. Investors who are subject to typical loss aversion should permanently allocate at least 5% to Trend Following, while investors whose loss aversion is lower can benefi t substantially by allocating materially more than 5%."


Are you looking for more strategies to read about? Check http://quantpedia.com/Screener

Do you want to see performance of trading systems we described? Check http://quantpedia.com/Chart/Performance

Do you want to know more about us? Check http://quantpedia.com/Home/About


Follow us on:

Facebook: https://www.facebook.com/quantpedia/

Twitter: https://twitter.com/quantpedia


Continue reading

Authoritarian Countries Have Inflated GDP

13.February 2019

There has been the shadow of suspicion that autocratic regimes are slightly manipulating GDP growth numbers. A recent academic paper offers interesting idea how to double check suspicious claims of growth …

Authors: Martinez

Title: How Much Should We Trust the Dictator's GDP Growth Estimates?

Link: https://papers.ssrn.com/sol3/papers.cfm?abstract_id=3093296

Abstract:

I study the manipulation of GDP growth statistics in non-democracies by comparing the self-reported GDP figures to the nighttime lights recorded by satellites from outer space. I show that the night-lights elasticity of GDP is systematically larger in more authoritarian regimes. This autocracy gradient in the elasticity is not explained by potential differences in a large set of factors, including economic structure and levels of development, across countries with different forms of government. The gradient is larger when countries have a stronger incentive to exaggerate economic performance or when the institutions that constrain the manipulation of official statistics are weaker. I estimate that the most authoritarian regimes inflate yearly GDP growth rates on average by a factor of 1.15-1.3 and show that correcting for data manipulation provides a more nuanced view on the economic success of non-democracies in recent years.

Notable quotations from the academic research paper:

"Governments themselves usually produce economic estimates, which gives rise to a moral hazard problem, as they are constantly tempted to exaggerate just how well the economy is doing. GDP stands out in this regard as perhaps the most widely used measure of economic activity. As such, it is probably the most profi table for governments to manipulate.

This paper uses nighttime luminosity to detect and measure the manipulation of GDP growth statistics in non-democracies. GDP and nighttime lights provide complementary measures of economic activity, but while GDP is self-reported by governments and prone to manipulation, night lights are recorded by satellites from outer space and are much less vulnerable. Using panel data for 179 countries between 1992 and 2008, I study the relationship between reported GDP figures and nighttime lights across political regimes. In particular, I examine whether the same amount of growth in lights translates into systematically larger amounts of GDP growth in autocracies than in democracies.

The main result of the paper is that the night-lights elasticity of GDP is signi ficantly larger in more autocratic regimes. In other words, I find that a constant amount of growth in lights translates into higher reported GDP growth in autocracies than in democracies. A large battery of further robustness tests indicates that the autocracy gradient in the night-lights elasticity of GDP is not driven by cross-country di erences in other factors that may be potentially correlated with regime type, including geography, economic structure or levels of development.

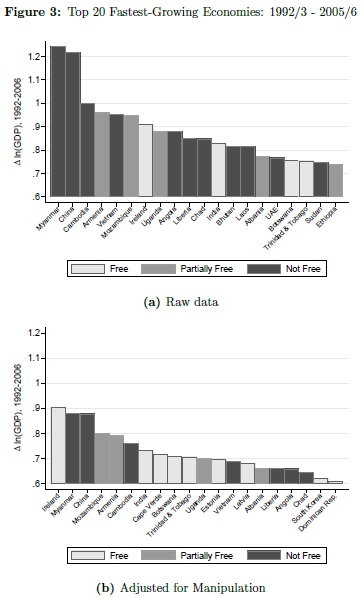
The observed magnitude of the variation in the night-lights elasticity of GDP across regimes is substantial. The results indicate that the most authoritarian governments inflate yearly GDP growth by a factor of 1.15-1.3. I use these estimates to adjust the long-run growth rates for data manipulation in autocracies. This adjustment has important implications for our understanding of relative economic performance at the turn of the XXI century.


fastest growing countries

"


Are you looking for more strategies to read about? Check http://quantpedia.com/Screener

Do you want to see an overview of our database of trading strategies? Check https://quantpedia.com/Chart

Do you want to know how we are searching new strategies? Check https://quantpedia.com/Home/How

Do you want to know more about us? Check http://quantpedia.com/Home/About


Follow us on:

Facebook: https://www.facebook.com/quantpedia/

Twitter: https://twitter.com/quantpedia
Continue reading

Tax Management is Extremely Important for Equity Factor Strategies

7.February 2019

Benjamin Franklin once said "… in this world nothing can be said to be certain, except death and taxes." and we completely agree with that quote. Traders and portfolio managers often strongly concentrate on a process of building the strategy which delivers the highest outperformance. But a lot of them forget to include taxes into that building process. And this can be a significant mistake as the following research paper shows:

Authors: Goldberg, Hand, Cai

Title: Tax-Managed Factor Strategies

Link: https://papers.ssrn.com/sol3/papers.cfm?abstract_id=3309974

Abstract:

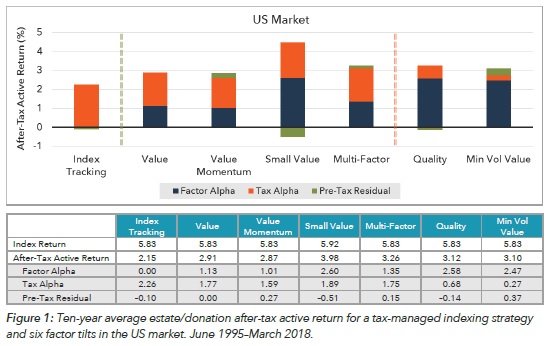
We examine the tax efficiency of an indexing strategy and six factor tilts. Between June 1995 and March 2018, average value added by tax management exceeded 1.4% per year at a 10- year horizon for all the strategies we considered. Tax-managed factor tilts that are beta 1 to the market generated average tax alpha between 1.6% and 1.9% per year, while average tax alpha for the tax-managed indexing strategy was 2.3% per year. These remarkable results depend on the availability of short-term capital gains to offset. To a great extent, they can be attributed to loss harvesting and the tax rate differential.

Notable quotations from the academic research paper:

"In 1993, Rob Jeffrey and Rob Arnott asked a provocative question: Is an investor’s alpha big enough to cover its taxes? Arnott and Jeffrey pointed out that alpha generation typically requires high turnover, which erodes pre-tax alpha by increasing taxes, but this important fact tended to be overlooked by investors and researchers. Twenty-five years later, the situation has not changed too much.

Some principles of tax-aware investing, such as locating high-tax investments in tax-deferred accounts or using tax-free municipal bonds (instead of their taxable counterparts) as investments and benchmarks, are no more than common sense. Other principles of taxaware investing may rely on more sophisticated mathematics and economics, as well as more detailed knowledge of the complex and ever-changing US tax code. An example of the latter would be loss harvesting, which is a tax-aware option that combines delayed realization of capital gains with immediate realization of capital losses. A second timing option, which depends on the tax rate differential, involves the realization of long-term gains in order to facilitate the harvesting of short-term losses.

In the present study, we document the performance of after-tax return and risk profiles of an indexing strategy and six factor tilts over the period June 1995 to March 2018.7 We focus on active return, and our results rely on a number of methodological innovations. We mitigate the substantial impact of period dependence on results by launching each strategy at regular intervals over a long horizon, generating ranges of outcomes obtained in different market climates. We construct each portfolio with a one-step optimization that balances the competing imperatives of constraining factor exposures, harvesting losses, and minimizing tracking error (TE) to a diversified benchmark. We develop an after-tax performance attribution scheme that decomposes estate/donation and liquidation active returns into factor alpha, tax alpha, and tracking return. We measure the impact of the tax rate differential that affects tax-managed factor tilts.

Our results span several dimensions. First, we compare after-tax performance of tax-managed versions to tax-indifferent versions of each strategy. In back-tests, average value added by tax management during the period studied exceeded 1.50% per year at 10-year horizon for all the strategies we considered. This finding illustrates the potential power of loss harvesting and lets us move on to the more nuanced topic of the loss-harvesting capacities of different strategies.


tax-managed factor strategies

Figure 1 presents the average after-tax active return of the tax-managed versions of the strategies graphically. Overall, the best average performance was delivered by the Small Value strategy, but more than half the after-tax active return was due to factor alpha. On the basis of tax alpha, the strategies divide into the three groups. The highest average tax alpha was delivered by the indexing strategy. Each of the four beta-1 strategies captured at least 70% of the tax alpha in the indexing strategy, but the two lower-risk strategies captured less than 35%. The division is marked in the performance charts."


Are you looking for more strategies to read about? Check http://quantpedia.com/Screener

Do you want to see an overview of our database of trading strategies? Check https://quantpedia.com/Chart

Do you want to know how we are searching new strategies? Check https://quantpedia.com/Home/How

Do you want to know more about us? Check http://quantpedia.com/Home/About


Follow us on:

Facebook: https://www.facebook.com/quantpedia/

Twitter: https://twitter.com/quantpedia
Continue reading

Cash-Flow Beta Doesn’t Explain the Value Premium

31.January 2019

A new research paper related mainly to:

#26 – Value (Book-to-Market) Anomaly

Authors: Zhou

Title: Can Cash-Flow Beta Explain the Value Premium?

Link: https://papers.ssrn.com/sol3/papers.cfm?abstract_id=3244791

Abstract:

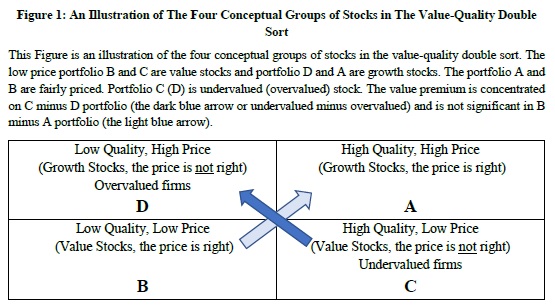
It is well documented that the cash flow beta can partly explain the source of the value premium. This paper presents an empirical test that cast doubt on this widely accepted belief. We double sort the stocks with their value and quality dimension and obtain four corner portfolios: (A) expensive quality, (B) cheap junk, (C) cheap quality and (D) expensive junk stocks. Prior research has shown that the value premium concentrates on cheap quality minus expensive junk (i.e. undervalued minus overvalued) but is not significant in cheap junk minus expensive quality stocks. If cash-flow beta is the source of the value premium, we would expect a larger cash-flow beta difference between the cheap quality and expensive junk portfolio. However, our empirical test shows that β_CF ((B) cheap junk) – β_CF ((A) expensive quality) >>β_CF ((C) cheap quality)-β_CF ((D) expensive junk). In other words, B minus A does not contribute to the profit of the value premium but contribute most to the difference of the cash flow beta between value and growth portfolios. Therefore, our result may serve as evidence that the cash flow beta may only spuriously explain the value premium. Or, at least, the cash-flow risk premium estimated in the portfolio regression approach is biased.

Notable quotations from the academic research paper:

"The value premium is one of the most important anomalies in the field of asset pricing. It is well known that the market beta fails to explain the value premium in the dataset after 1963.

Campbell and Vuolteenaho (2004) first proposed a “good beta, bad beta” model to solve this dilemma. They decompose the traditional market beta into two components: A good beta is the beta that measures a stock’s covariance with the temporary market movement or discount rate news, which is usually induced by changing market sentiment and varying risk aversion; A bad beta measures a stock’s comovement with market-wide fundamental cash-flow news. Campbell and Vuolteenaho (2004) and Cohen, Polk, Vuolteenaho(2009) argue that investors will regard wealth decrease induced by discount rate news as less significant because it tends to be temporary and the investors will be compensated by better future investment opportunity in an increased discount rate environment. A rational investor will demand higher return for the bad beta than the good beta.

Together with Campbell and Vuolteenaho (2004), Cohen, Polk, Vuolteenaho(2009), Campbell, Polk and Vuolteenaho (2010) and Da and Warachka (2009) among others, use different proxy for the cash-flow news and find that value stocks have a higher cash-flow beta than growth stocks. They conclude that cash-flow beta is one of the sources of the value premium. In this paper, we present an empirical test that question this widely accepted belief.

Our test double-sorts the stocks by value and quality dimension. In a conceptual simplified picture, Figure 1 illustrates four groups of stocks: (A) high quality, high price (expensive quality), (B) low quality, low price (cheap junk), (C) high quality, low price (cheap quality), and (D) low quality, high price (expensive junk). The price of portfolio A and B is thought to be “right” as their price is more aligned with the quality. Portfolio C (D) is the undervalued (overvalued) stocks.

value vs. quality

High price portfolio A and D are growth stocks, and low price portfolio B and C are value stocks. The value premium is the return of ( + ) − ( + ) = ( − ) + ( − ) . ( − ) and ( − ) are represented respectively by the light blue and dark blue arrow in Figure 1.

When the price is “right”, the value premium is not significant. The value premium is concentrated on ( − ), but not on ( − ). The return of the four portfolio have the relationship: R > R ≈ R > R .

If the cash flow beta is the source of the value premium and the value premium is concentrated on ( − ), one would naturally expect that f( ) − f( ) ≫ f( ) − f( ), in which, f is the cash flow beta. However, in our
test, we find the opposite results: f( ) − f( ) ≫ f( ) − f( ). ( − ) does not contribute to the profit of the value premium while f( ) − f( ) contribute the most to the cash-flow beta difference between the value and growth portfolio.

If the cash-flow beta represents a risk, we take most of the risk in the value-junk minus growth quality portfolio, but we earn no profit or even negative profit. We take very little or negative risk in the value-quality minus growth-junk portfolio, but we earn most of the profit of the value premium. We need to find a plausible explanation to this phenomena before we conclude that the cash-flow risk is the source of the value premium. A fundamental reason of our result is that, on the value dimension, higher return links to a higher cash-flow beta, while on the quality dimension, higher return links to a lower cash-flow beta."


Are you looking for more strategies to read about? Check http://quantpedia.com/Screener

Do you want to see an overview of our database of trading strategies? Check https://quantpedia.com/Chart

Do you want to know how we are searching new strategies? Check https://quantpedia.com/Home/How

Do you want to know more about us? Check http://quantpedia.com/Home/About


Follow us on:

Facebook: https://www.facebook.com/quantpedia/

Twitter: https://twitter.com/quantpedia
Continue reading

Subscribe for Newsletter

Be first to know, when we publish new content


    logo
    The Encyclopedia of Quantitative Trading Strategies

    Log in