Currency Hedging with Currency Risk Factors

23.January 2019

A new research paper related to multiple currency risk factors:

#5 – FX Carry Trade
#129 – Dollar Carry Trade

Authors: Opie, Riddiough

Title: Global Currency Hedging with Common Risk Factors

Link: https://papers.ssrn.com/sol3/papers.cfm?abstract_id=3264531

Abstract:

We propose a novel method for dynamically hedging foreign exchange exposure in international equity and bond portfolios. The method exploits time-series predictability in currency returns that we find emerges from a forecastable component in currency factor returns. The hedging strategy outperforms leading alternative approaches out-of-sample across a large set of performance metrics. Moreover, we find that exploiting the predictability of currency returns via an independent currency portfolio delivers a high risk-adjusted return and provides superior diversification gains to global equity and bond investors relative to currency carry, value, and momentum investment strategies.

Notable quotations from the academic research paper:

"How should global investors manage their foreign exchange (FX) exposure? The classical approach to currency hedging via mean-variance optimization is theoretically appealing and encompasses both risk management and speculative hedging demands. However, this approach, when applied out of sample, suff ers from acute estimation error in currency return forecasts, which leads to poor hedging performance.

In this paper we devise a novel method for dynamically hedging FX exposure using mean-variance optimization, in which we predict currency returns using common currency risk factors.

Recent breakthroughs in international macro- nance have documented that the cross-section of currency returns can be explained as compensation for risk, in a linear two-factor model that includes dollar and carry currency factors. The dollar factor corresponds to the average return of a portfolio of currencies against the U.S. dollar, while the carry factor corresponds to the returns on the currency carry trade.

We take the perspective of a mean-variance U.S. investor who can invest in a portfolio of `G10' developed economies. We adopt the standard assumption that the investor has a predetermined long position in either foreign equities or bonds and desires to optimally manage the FX exposure using forward contracts. We form estimates of currency returns using a conditional version of the two-factor model where both factor returns and factor betas are time-varying.

A related literature provides strong empirical evidence, with underpinning theoretical support, that the dollar and carry factor returns are partly predictable. We exploit this predictability to forecast currency returns. Speci ffically, we estimate factor betas and 1-month ahead dollar and carry factor returns in the time series, and then form expected bilateral currency returns using these estimates. This vector of expected currency returns enters the mean-variance optimizer to produce optimal, currency-speci fic, hedge positions. We update the positions monthly and refer to the approach as Dynamic Currency Factor (DCF) hedging.

currency hedging

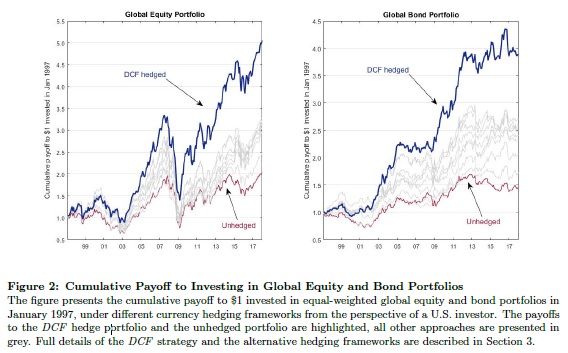
We evaluate the performance of DCF hedging, over a 20-year out-of-sample period, against nine leading alternative approaches ranging from naive solutions in which FX exposure is either fully hedged or never hedged, through to the most sophisticated techniques that also adopt mean-variance optimization. We nd DCF hedging generates systematically superior out-of-sample performance compared to all alternative approaches across a range of statistical and economic performance measures for both international equity and bond portfolios. As a preview, in Figure 2 we show the cumulative payoff to a $1 investment in international equity and bond portfolios in January 1997. When adopting DCF hedging, the $1 investment grows to over $5 by July 2017 for the global equity portfolio, and to almost $4 for the global bond portfolio. These values contrast with $2 and $1.5, which a U.S. investor would have obtained, if the FX exposure in the equity or bond portfolios was left unhedged."


Are you looking for more strategies to read about? Check http://quantpedia.com/Screener

Do you want to see an overview of our database of trading strategies? Check https://quantpedia.com/Chart

Do you want to know how we are searching new strategies? Check https://quantpedia.com/Home/How

Do you want to know more about us? Check http://quantpedia.com/Home/About


Follow us on:

Facebook: https://www.facebook.com/quantpedia/

Twitter: https://twitter.com/quantpedia

Continue reading

Biased Betting Against Beta?

17.January 2019

A new research paper related mainly to:

#77 – Beta Factor in Stocks

Authors: Novy-Marx, Velikov

Title: Betting Against Betting Against Beta

Link: https://papers.ssrn.com/sol3/papers.cfm?abstract_id=3300965

Abstract:

Frazzini and Pedersen’s (2014) Betting Against Beta (BAB) factor is based on the same basic idea as Black’s (1972) beta-arbitrage, but its astonishing performance has generated academic interest and made it highly influential with practitioners. This performance is driven by non-standard procedures used in its construction that effectively, but non-transparently, equal weight stock returns. For each dollar invested in BAB, the strategy commits on average $1.05 to stocks in the bottom 1% of total market capitalization. BAB earns positive returns after accounting for transaction costs, but earns these by tilting toward profitability and investment, exposures for which it is fairly compensated. Predictable biases resulting from the paper’s non-standard beta estimation procedure drive results presented as evidence supporting its underlying theory.

Notable quotations from the academic research paper:

" Frazzini and Pedersen’s (FP) Betting Against Beta (BAB, 2014) is an unmitigated academic success. Despite being widely read, and based on a fairly simple idea, BAB is not well understood. This is because the authors use three unconventional procedures to construct their factor. All three departures from standard factor construction contribute to the paper’s strong empirical results. None is important for understanding the underlying economics, and each obscures the mechanisms driving reported effects.

Two of these non-standard procedures drive BAB’s astonishing “paper” performance, which cannot be achieved in practice, while the other drives results FP present as evidence supporting their theory. The two responsible for driving performance can be summarized as follows:

Non-standard procedure #1, rank-weighted portfolio construction: Instead of simply sorting stocks when constructing the beta portfolios underlying BAB, FP use a “rank-weighting” procedure that assigns each stock to either the “high” portfolio or the “low” portfolio with a weight proportional to the cross-sectional deviation of the stock’s estimated beta rank from the median rank.

Non-standard procedure #2, hedging by leveraging: Instead of hedging the low beta-minus-high beta strategy underlying BAB by buying the market in proportion to the underlying strategy’s observed short market tilt, FP attempt to achieve market-neutrality by leveraging the low beta portfolio and deleveraging the high beta portfolio using these portfolios’ predicted betas, with the intention that the scaled portfolios’ betas are each equal to one and thus net to zero in the long/short strategy.

BAB equally weighted portfolio

FP’s first of these non-standard procedures, rank-weighting, drives BAB’s performance not by what it does, i.e., put more weight on stocks with extreme betas, but by what it does not do, i.e., weight stocks in proportion to their market capitalizations, as is standard in asset pricing. The procedure creates portfolios that are almost indistinguishable from simple, equal-weighted portfolios. Their second non-standard procedure, hedging with leverage, uses these same portfolios to hedge the low beta-minus-high beta strategy underlying BAB. That is, the rank-weighting procedure is a backdoor to equal-weighting the underlying beta portfolios, and the leveraging procedure is a backdoor to using equal-weighted portfolios for hedging.

BAB with costs

BAB achieves its high Sharpe ratio, and large, highly significant alpha relative to the common factor models, by hugely overweighting micro- and nano-cap stocks. For each dollar invested in BAB, the strategy commits on average $1.05 to stocks in the bottom 1% of total market capitalization. These stocks have limited capacity and are expensive to trade. As a result, while BAB’s “paper” performance is impressive, it is not something an investor can actually realize. Accounting for transaction costs reduces BAB’s profitability by almost 60%. While it still earns significant positive returns, it earns these by tilting toward profitability and investment, exposures for which it is fairly compensated."


Are you looking for more strategies to read about? Check http://quantpedia.com/Screener

Do you want to see an overview of our database of trading strategies? Check https://quantpedia.com/Chart

Do you want to know how we are searching new strategies? Check https://quantpedia.com/Home/How

Do you want to know more about us? Check http://quantpedia.com/Home/About


Follow us on:

Facebook: https://www.facebook.com/quantpedia/

Twitter: https://twitter.com/quantpedia

Continue reading

The Size Effect Has a Lottery-Style Payoff

11.January 2019

A new research paper related mainly to:

#25 – SIze Premium

Authors: McGee, Olmo

Title: The Size Premium As a Lottery

Link: https://papers.ssrn.com/sol3/papers.cfm?abstract_id=3279645

Abstract:

We investigate empirically the dependence of the size effect on the top performing stocks in a cross-section of risky assets separated by industry. We propose a test for a lottery-style factor payoff based on a stochastic utility model for an under-diversified investor. The associated conditional logit model is used to rank different investment portfolios based on size and we assess the robustness of the ranking to the inclusion/exclusion of the best performing stocks in the cross-section. Our results show that the size effect has a lottery-style payoff and is spurious for most industries once we remove the single best returning stock in an industry from the sample each month. Analysis in an asset pricing framework shows that standard asset pricing models fail to correctly specify the size premium on risky assets when industry winners are excluded from the construction of the size factor. Our findings have implications for stock picking, investment management and risk factor analysis.

Notable quotations from the academic research paper:

" Firms with small market capitalization tend to outperform larger companies. Investors are attracted to lottery-like assets with positively skewed returns because they o ffer a very large payoff with a small probability, which the investors overweight. This demand makes positively skewed securities overpriced and likely to earn low returns. In this article we test whether the size/market capitalization attribute, and associated factor-mimicking portfolios, receive a lottery-like payoff . The implications of this are that most small stocks do not payoff and the returns to a size strategy are driven by a small number of winners. This type of payo ff can be captured through diversi fication but leaves an under-diversifi ed investor exposed. The risk being that they will not include winning stocks and their resulting return expectation is negative.

To investigate the e ffect of winning stocks on the performance of investment portfolios based on the size we propose a conditional logit model for ranking di fferent investment portfolios based on size and assess the robustness of the ranking to the inclusion/exclusion of the best performing stocks in the cross-section. This parametric choice is embedded within a stochastic utility model for explaining the investment decisions of under-diversi fied size investors aiming to exploit the so-called size premium. under-diversifi ed individuals maximize their expected utility in each period by choosing the stock that is predicted to yield the highest return (highest positive skew). This choice is driven by market capitalization of the portfolio and modeled parametrically using the conditional logit model.

In order to obtain cross-sectional variation on the relationship between the size e ffect and portfolio performance we split the whole cross-section of stocks into di fferent industries and fi t the conditional logit model to each industry separately. We apply the conditional logit model at an industry-speci fic level across three ranked sorted portfolios based on market capitalization: a small, mid-size and big portfolio created from the stocks in each tercile of the cross-section of assets in a speci fic industry ranked by asset size. This exercise is repeated for 20 industries over the period January 1970 to November 2015. Our results reveal that the size e ffect vanishes once the top performing stocks in an industry are removed from the sample.

size lottery

Our empirical findings also highlight the role of industry momentum in determining the relationship between market capitalization and portfolio performance. Speci fically, market capitalization has signi ficantly better predictive ability for portfolio return performance in the months following a positive return in an industry than in the months following a negative industry return.

Given these findings, we investigate further the influence of the winning stocks in industry-speci fic size portfolios. In particular, we propose an alternative size portfolio that we denominate as the winner-weighted index, based on the forecast rank probabilities of stocks provided by the conditional logit model. Intuitively, those stocks that are predicted to be winners in the next period receive a larger allocation of wealth than those stocks that have a low probability of becoming winners. More formally, the allocation of wealth to each asset in the portfolio is determined by the forecast winning probabilities obtained from the conditional logit model and driven by asset size. The performance of this portfolio is compared against a cap-weighted index benchmark portfolio. The weights in the latter portfolio are also driven by market capitalization, however, in contrast to our winner-weighted index portfolio, smaller stocks within an industry receive a smaller allocation of wealth. We consider statistical and economic measures such as the Sharpe ratio, Sortino ratio, the certainty equivalent return of a mean-variance investor and portfolio turnover. We observe the existence of two regimes in portfolio performance. During positive industry momentum periods, the winner-weighted index outperforms the cap-weighted portfolio for 19 out of 20 industries, the exception being the utilities industry. This result is, however, reversed in periods of negative industry momentum for which the cap-weighted index outperforms the winner-weighted index in 18 out of 20 industries.

Our second objective is to explore the influence of winning stocks on the size portfolio pricing factor widely used in the empirical asset pricing literature. Our empirical results for both a top-minus-bottom trading portfolio and a long-only portfolio show that standard asset pricing models are not able to adequately capture the contribution of the size premium to the overall risk premium when the winning stocks are removed from the size factor portfolio. In contrast, we note that the factor loadings ( Beta's) associated to the size portfolio pricing factor in standard models are robust to the inclusion/exclusion of the winning stocks. The removal of winning stocks is a ffecting the risk premium rather than the covariance of portfolios with the risk factor."


Are you looking for more strategies to read about? Check http://quantpedia.com/Screener

Do you want to see an overview of our database of trading strategies? Check https://quantpedia.com/Chart

Do you want to know how we are searching new strategies? Check https://quantpedia.com/Home/How

Do you want to know more about us? Check http://quantpedia.com/Home/About


Follow us on:

Facebook: https://www.facebook.com/quantpedia/

Twitter: https://twitter.com/quantpedia

Continue reading

Quantpedia’s Solution for Bear Markets

6.January 2019

Dear readers,

Equity markets have once again entered a high volatility regime at the end of the year 2018. Risk of an economic slowdown increases and investors and traders are looking for  trading strategies which can perform well in such uncertain times.

We at Quantpedia can help with that!

I am really excited to give you an opportunity to work with a new filtering field in our Screener, which you can use to find  strategies that can be utilized as a hedge/diversification to equity market risk factor during bear markets.

Come and find your new hedge!

Team of Quantpedia.com
 

Continue reading

ETFs Increase Correlation of International Equity Markets

4.January 2019

Everybody can see that international equity markets are highly correlated (and especially during past 10-15 years). A new interesting financial research paper shows that ETF arbitrage mechanism is one of the key channels through which U.S. shocks propagate to local economies leading to increased return correlation with the U.S. market:

Authors: Filippou, Gozluklu, Rozental

Title: ETF Arbitrage and International Correlation

Link: https://papers.ssrn.com/sol3/papers.cfm?abstract_id=3287417

Abstract:

Assets under management of exchange-traded funds (ETF) have been growing significantly, yet the majority of ETF trades still occur on U.S. exchanges. We show that investment decisions of both institutional and retail investors when trading international country ETFs are mostly driven by shocks related to U.S. fundamentals, measured by VIX, rather than local country risks. Investors react only to negative news about local economies. When U.S. economic uncertainty increases, investors leave the country ETF market and switch to Cash ETF products. We demonstrate that ETF arbitrage mechanism is one of the key channels through which U.S. shocks propagate to local economies leading to increased return correlation with the U.S. market both in time-series and cross-sectional dimensions. We find that countries with stronger ETF price-discovery and lower limits to arbitrage tend to have a higher comovement with the U.S. market.

Notable quotations from the academic research paper:

"Signi ficant innovations in financial products made international investments increasingly possible. Over the recent years, exchange-traded funds experienced a double-digit growth in assets under management. Nevertheless, the short-run interdependence of trading across major international ETFs and its association with local and global risk aversion remain understudied. While the majority of earlier studies focuses on direct eff ects of ETFs on the underlying securities in the basket that it tracks, we examine the indirect e ffect of ETF trading as a transmission mechanism of U.S. market shocks to foreign country equity markets.

We provide a view that as the U.S. accommodates the largest share of ETF global trading volume, its market conditions directly impact the decisions of country ETF investors. We show that international ETF market participants trade based on shocks related to U.S. fundamentals rather than local ones, and propagate those shocks to local markets. The shock transmission is performed via ETF arbitrage. We argue that such arbitrage activity is one of the few mechanisms responsible for increasing correlation between the U.S. market and the rest of the world.

This high cross-country correlation limits the ability of investors to cheaply diversify U.S. risk via international ETF investments. In addition, ETFs often provide an easier access to less integrated emerging markets or to countries were direct investments are costly (e.g., Brazil). However, the transmission of U.S. shocks to those markets limits the diversi fication bene ts of emerging market strategies.

correlation

We fi rst test the hypothesis whether country ETF investors react to changes in the U.S. rather than local economic uncertainty, as measured by CBOE Volatility Index (VIX). To this end, we compute order imbalances of retail investors (e.g., Boehmer, Jones, and Zhang, 2017), and trades of di fferent size, capturing high frequency trading (HFT) and institutional trades. Focusing on a large cross-section of 41 countries, we find strong association between ETF order imbalances and U.S. VIX, indicating that international investment decisions are mainly driven by the latter measure, rather than its local counterparts. For example, an increase in the U.S. VIX results in a selling pressure in the country ETF market. Such result is robust to di fferent volatility regimes and is consistent across di fferent types of investors. Asymmetric response analysis confi rms that country ETF investors only react to positive changes in local VIX, which correspond to negative news in the local markets. Moreover, we observe that, when reacting to an increase in U.S. uncertainty, investors switch to safer assets such as cash equivalent ETFs. We also find that investors respond to changes in U.S. political uncertainty di fferently than to economic uncertainty – they leave the U.S. stock market and buy international country-level ETFs. However, they do not react to local political uncertainty and the economic eff ect of political risk is much smaller than of changes in U.S. VIX.

In order to access the impact of ETF arbitrage on correlation of country returns with the U.S. market, we regress daily innovations in such correlation on a proxy for ETF arbitrage during di fferent volatility regimes. We provide time-series evidence that during periods of high volatility in the U.S., an increase in the arbitrage activity by the authorized participant (AP) (as measured by net share creation/redemption) results in an increase in innovation in such daily correlation. We argue that during periods of high volatility in the U.S. market, it is harder for investors to distinguish between noise and fundamental component of the order flow. Consequently, based on wake-up call hypothesis investor may treat U.S. shocks as relevant to their own country and consume such shocks via ETF arbitrage.

We also explain cross-country variation in return correlation with the U.S. market. According to Ben-David, Franzoni, and Moussawi (2018), non-fundamental shocks must be reversed over time. This suggests that if all shocks transmitted from ETF market to local economies were non-fundamental, ETF arbitrage would not contribute towards increased correlation. In contrast, if the price deviation from the NAV is due to faster incorporation of fundamental information in ETF market, then arbitrage should a ffect returns of underlying index, and such e ffect should not be reverted. If such fundamental information is common both to U.S. and local market, one should observe a higher correlation between them.

Consistent with the literature, we argue that ETF transmits both fundamental and noise shocks to the underlying economies. We show that countries that have a higher degree of price discovery in their ETFs have on average a higher correlation with the U.S. market. In these markets fundamental information gets incorporated into ETF prices faster than in the Net Asset Value (NAV), and therefore, market makers closely follow and learn from changes in ETF prices. This is the case when derivative securities price the underlying assets, rather than the other way around. In addition, in order for fundamental shocks to get transmitted to underlying markets, the authorised participants (AP) must engage in arbitrage activity. We find that the lower the limits to ETF arbitrage the higher is the correlation between a country and the U.S. market. Neither the international trade channel nor the business cycles alter this result."


Are you looking for more strategies to read about? Check http://quantpedia.com/Screener

Do you want to see an overview of our database of trading strategies? Check https://quantpedia.com/Chart

Do you want to know how we are searching new strategies? Check https://quantpedia.com/Home/How

Do you want to know more about us? Check http://quantpedia.com/Home/About


Follow us on:

Facebook: https://www.facebook.com/quantpedia/

Twitter: https://twitter.com/quantpedia

Continue reading

Quantpedia Update – 3rd January 2019

3.January 2019

Two new strategies have been added:

#414 – Patent-to-Market Equity Factor
#415 – Sovereign CDS Predicts FX Market Return

Two new related research papers have been included into existing strategy reviews. And two additional related research papers have been included into existing free strategy reviews during last few weeks.

Continue reading

Subscribe for Newsletter

Be first to know, when we publish new content


    logo
    The Encyclopedia of Quantitative Trading Strategies

    Log in