FOMC Equity Drift Occurs in Periods of High Uncertainty

27.December 2018

A new research paper related mainly to:

#75 – Federal Open Market Committee Meeting Effect in Stocks

Authors: Martello, Ribeiro

Title: Pre-FOMC Announcement Relief

Link: https://papers.ssrn.com/sol3/papers.cfm?abstract_id=3286745

Abstract:

We show that the pre-FOMC announcement drift in equity returns occurs mostly in periods of high market uncertainty or risk premium. Specifically, this abnormal return is explained by a significant reduction in the risk premium (implied volatility and variance risk premium) prior to the announcement, but only when the risk premium is high, e.g., when it is above its median. Likewise, the magnitude of the FOMC Cycle and other related patterns varies with uncertainty and risk premium. Market uncertainty measures are persistent and are not related to policy uncertainty or expectations. Markets become only marginally stressed in the days prior to the announcement and changes in uncertainty appear to be of lower frequency. We also explain why recent studies suggest that the pre-FOMC drift might have disappeared in the past decade, as this moderation is due to time variation that was also present in older data. Additionally, CAPM only works on FOMC dates when the risk premium is high, e.g., implied vol above its prior median level. The results are robust to different samples and measures of risk premium and uncertainty.

Notable quotations from the academic research paper:

"We show that pre-announcement return drift is associated with significant declines in risk (premium) during times of high risk (premium). Implied volatility and the variance risk premium decrease in the hours before the announcement in an almost perfect mirror image of the increase in market prices. Moreover, we show that the magnitude of the return drift and the decline in risk depends on the level of market implied volatility, or other related variables, days or even weeks prior to the announcement.

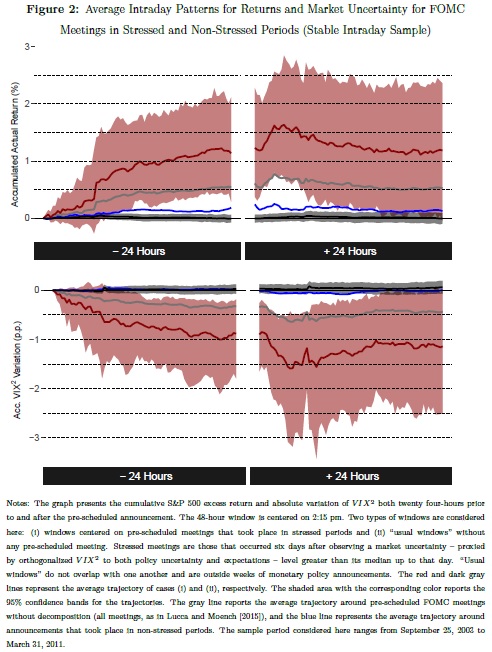
Just to exemplify, the average pre-FOMC drift when implied volatility is above its prior median is 109 basis points (bps), while it is only 9.7 bps when it is below its median. In the bottom 20% of implied volatilities, the drift is close to zero or even negative, depending on the specification. Lucca and Moench [2015] also showed the importance of the VIX in their analysis, but here we show that this and other market uncertainty variables are actually essential for a better understanding of the pre-announcement return drift and all FOMC announcement related patterns. Figure 2 replicates a figure in Lucca and Moench [2015] that shows stock market performance around FOMC releases. Here we show that the pre-announcement drift is much stronger in periods of high risk premium and uncertainty.

We also provide clear evidence of investor relief, i.e., a decline in implied volatility or other risk measures, hours before the announcement using intraday information. Panel B of Figure 2 also shows that uncertainty is going down as a mirror image of the realized return. The magnitude of this pre-announcement investor relief also depends on the level of market uncertainty, as it tends to go down more when it is high. Considering the squared value of the VIX as our priced risk proxy, we show that, during high volatility periods, implied variance declines by 103.5 bps in anticipation of the announcement, while during low volatility periods, it rises by insignificant 0.3 bps. Hence, high volatility periods present both higher realized equity returns and greater resolution of market uncertainty hours before pre-scheduled announcements.

FOMC return patterns"


Are you looking for more strategies to read about? Check http://quantpedia.com/Screener

Do you want to see an overview of our database of trading strategies? Check https://quantpedia.com/Chart

Do you want to know how we are searching new strategies? Check https://quantpedia.com/Home/How

Do you want to know more about us? Check http://quantpedia.com/Home/About


Follow us on:

Facebook: https://www.facebook.com/quantpedia/

Twitter: https://twitter.com/quantpedia

Continue reading

Bitcoin Returns Resemble Returns of High Sentiment Beta Stocks

21.September 2018

A new financial research paper has been published and is related to cryptocurrency trading strategies:

Author: Jo, Park, Shefrin

Title: Bitcoin and Sentiment

Link: https://papers.ssrn.com/sol3/papers.cfm?abstract_id=3230572

Abstract:

On the surface, cryptocurrencies share important features in common with high sentiment beta stocks. Baker and Wurgler (2007) identify high sentiment betas with small startup firms that have great growth potential. This paper investigates the degree to which, during the period July 18, 2010 to February 26, 2018, the return to bitcoin displayed the characteristics of a high sentiment beta stock. Using a sentiment-dependent factor model, the analysis indicates that in large measure, bitcoin returns resembled returns to high sentiment beta stocks.

Notable quotations from the academic research paper:

"The main objective of this paper is to investigate the degree to which bitcoin resembles a “high sentiment beta” stock, a term introduced by Baker and Wurgler (2007). They note that some stocks are more vulnerable to being mispriced than others, stating: “stocks of low capitalization, younger, unprofitable, high-volatility, non–dividend paying, growth companies … are likely to be disproportionately sensitive to broad waves of investor sentiment.” This statement implies that when investors become excessively optimistic about stocks in general, they become even more optimistic about stocks of small firms that, while not currently profitable, are perceived as holding great potential for future profitability. Baker and Wurgler describe stocks that are disproportionately sensitive to investor sentiment as featuring “high sentiment beta.”

bitcoin's alpha

Table 3 presents the coefficient estimates of CAPM, Fama-French three, Carhart four, and Fama-French five factor models for U.S. daily excess returns on excess Bitcoin Return. We note that Jensen’s alpha is significant and positive at the 0.1% significance level in all the above asset pricing models during our sample period. Notice too that all of the coefficients of CAPM and Fama-French market and other factors are insignificant, suggesting that bitcoin returns are largely nonsystematic, at least from the perspective of a traditional factor pricing model.

There are at least three different channels by which sentiment can impact bitcoin returns. The first channel is bitcoin-specific, which is reflected in bitcoin’s Jensen’s alpha. The second channel involves the sensitivity of bitcoin’s price to general market sentiment. Baker and Wurgler (2007) describe such sentiment as general optimism about stocks.

The third channel involves the manner in which sentiment mediates fundamental factor loadings, as noted by Baker and Wurgler (2006). Of special interest is the impact of sentiment on factor loadings associated with size (SMB) and profitability (RMW), because of the analogy between bitcoin and Baker and Wurgler’s association of high sentiment beta to small startup firms that are not yet profitable but possess great growth potential. Because bitcoin is the cryptocurrency most closely associated with a blockchain technology, and blockchain activity is positively related to general economic activity, our prior expectation is that bitcoin returns will be statistically related to the market risk premium.

factor loadings

The results displayed in Table 5 Panel A indicate the following. First, the returns to bitcoin are statistically related to the market risk premium. Moreover, the interaction term involving the market risk premium features a negative coefficient. Therefore, when sentiment declines, bitcoin returns become more sensitive to the market risk premium.

Factor loading estimates for two other interaction terms are statistically significant. The first pertains to size (SMB), with a negative sign, and the second pertains to investment (CMA), with a positive sign. The bitcoin size effect is that when sentiment declines, bitcoin returns share a common feature with the stocks of small firms. This finding has the same flavor as Baker and Wurgler’s finding that the size effect only applies in connection with periods of negative sentiment. In particular, this finding is in line with the intuitive association of new cryptocurrencies to the stocks of small startups. The bitcoin investment effect is that when sentiment declines, bitcoin returns share a commonality with firms that invest aggressively rather than conservatively. In this respect, aggressive investment reduces firms’ free cash flows and equity returns, whose effect on bitcoin is most pronounced during times in which investors generally become more bearish.

Table 5 Panel A indicates that bitcoin returns are statistically related to the coefficient on the Fama-French profitability factor RMW ( 5 ), and with a positive sign. Therefore, the return to holding bitcoin is generally positive during periods when the stocks of higher profitability firms outperform the stocks of lower profitability firms. At first glance, this finding appears to be at odds with bitcoin returns resembling the returns to the stocks of unprofitable firms. However, in interpreting this finding, it is important to keep in mind that the return to small growth stocks cannot be explained by the Fama-French three-factor model, as those stocks have historically earned low returns, not the high returns predicted by the model. Similarly, in the extended Fama-French factor model, profitability is related differently to small, growth stocks than to other stocks.

One of the main implications of the regression analysis above is that sentiment impacts bitcoin returns indirectly through traditional factors, but with no direct discernable direct effect. This leaves open the question of how bitcoin returns and sentiment have coevolved over time. To investigate this issue, we employ Vector Auto Regression (VAR) models that focus on the dynamic relationship between Investor sentiment index and Bitcoin Return.

VAR model

The results suggest that while Bitcoin Returns do not Granger-cause Investor Sentiment Index for the Investor Sentiment equations (Panel B), Investor Sentiment Index does Granger-cause Bitcoin Returns for the ratio of the Bitcoin Returns equation (Panel A). In particular, bullish (bearish) investor sentiment significantly drives Bitcoin Returns positively (negatively). It is noteworthy that although the time period of the bitcoin price decrease (i.e., January-February, 2018) is much shorter, and the percentage of bearish investor sentiment is somewhat lower, the negative impact of bearish investor sentiment on Bitcoin Returns seems to be a bit larger than the positive impact of bullish investor sentiment on Bitcoin Returns.

We further conduct VAR analysis with alternative measure of investor sentiment, Volatility Index (VIX) for robustness, and present the results in Table 9.

sensitivity to vix

In Bitcoin Return equation, the coefficient on VIX (lagged 1) is significantly negative, which implies that a change in VIX index from day t–30 to day t negatively affects bitcoin return. This negative impact of VIX on Bitcoin Returns can be interpreted to mean that investors’ fear about the future market tends to induce a decrease in the price of bitcoin. Intuitively, when the volatility index increases, investors grow afraid of increased volatility, and sell bitcoin, lowering the bitcoin price. Expressed differently, if the VIX decreases, then the market is less volatile, and investors become willing to take risks to earn above average returns by buying bitcoin, thereby driving up its price."


Are you looking for more strategies to read about? Check http://quantpedia.com/Screener

Do you want to see performance of trading systems we described? Check http://quantpedia.com/Chart/Performance

Do you want to know more about us? Check http://quantpedia.com/Home/About


Follow us on:

Facebook: https://www.facebook.com/quantpedia/

Twitter: https://twitter.com/quantpedia

Continue reading

Announcing QuantConnect & Quantpedia Cooperation

23.July 2018

The Quantpedia site was created seven years ago and, over time, our pet project evolved into something bigger. We started small, but we always wanted to have a wide scope of strategies in our database. Our goal was to find, analyze, describe and categorize as many quant trading strategies as possible. Thus, we did not limit our focus to only one asset class, trading style, or instrument type.
 

Our database contains strategies on all asset classes (equities, bonds, commodities, etc.), trading styles, and popular instruments. However, this very broad approach brings one major issue: we’ve never had the resources to backtest the strategies we find in the thousands of academic research papers, so we could never independently validate them. Until now…


I am really excited to introduce our cooperation with QuantConnect. With the company’s resources and extensive database of historical data, combined with a backtesting engine, QuantConnect was able to start systematically backtesting strategies from our database. And now, we can finally start showing you out-of-sample backtests for some of our strategies.


If you’re unfamiliar, QuantConnect is a cloud-based algorithmic trading platform that enables its community of more than 60k quants, computer scientists, and engineers to backtest and deploy live strategies to brokerages such as Interactive Brokers and Coinbase Pro.

At the moment, QuantConnect has covered nearly 20 strategies and will continue to periodically add new strategy implementations in the future.

The QuantConnect out-of-sample backtests can be found at the bottom of Quantpedia strategy's subpage. Let’s look, for example, at strategy #2 – Asset Class Momentum. If you scroll down on that page, after a description of Asset Class Momentum strategy and links to source and related research papers, you’ll see a section with embedded code, an out-of-sample chart, and performance and risk statistics, all from QuantConnect.

Embedded code:
 

quantconnect code
 

An out-of-sample chart:
 

quantconnect chart
 

Performance and risk statistics:

quantconnect statistics
 

We plan to add a new field into our Screener (https://quantpedia.com/Screener) which will allow you to filter our strategies with QuantConnect backtests. Until then, a list of links to strategies that currently have this feature enabled is below:


#1 – Asset Class Trend Following (+ link to Quantconnect's subpage Asset Class Trend Following)
#2 – Asset Class Momentum (+ link to Quantconnect's subpage Asset Class Momentum)
#3 – Sector Momentum (+ link to Quantconnect's subpage Sector Momentum)
#4 – Overnight Anomaly (+ link to Quantconnect's subpage Overnight Anomaly)
#5 – Forex Carry Trade (+ link to Quantconnect's subpage Forex Carry Trade)
#7 – Volatility Effect in Stocks (+ link to Quantconnect's subpage Volatility Effect in Stocks)
#8 – Forex Momentum (+ link to Quantconnect's subpage Forex Momentum)
#12 – Pairs Trading (+ link to Quantconnect's subpage Pairs Trading – Cupola vs. Cointegration)
#13 – Short Term Reversal (+ link to Quantconnect's subpage Short Term Reversal)
#14 – Momentum Effect in Stocks (+ link to Quantconnect's subpage Momentum Effect in Stocks)
#15 – Momentum Effect in Country Equity Indexes (+ link to Quantconnect's subpage Momentum Effect in Country Equity Indexes)
#16 – Mean Reversion Effect in Country Equity Indexes (+ link to Quantconnect's subpage Mean Reversion Effect in Country Equity Indexes)
#18 – Liquidity Effect in Stocks (+ link to Quantconnect's subpage Liquidity Effect in Stocks)
#20 – Volatility Risk Premium Effect (+ link to Quantconnect's subpage Volatility Risk Premium Effect)
#21 – Momentum Effect in Commodities (+ link to Quantconnect's subpage Momentum Effect in Commodities)

#22 – Term Structure Effect in Commodities (+ link to Quantconnect's subpage Term Structure Effect in Commodities)
#25 – Small Capitalization Stocks Premium Anomaly (+ link to Quantconnect's subpage Small Capitalization Stocks Premium Anomaly)
#26 – Book-to-Market Value Anomaly (+ link to Quantconnect's subpage Book-to-Market Value Anomaly)


We are really thrilled that we can show you this new part of our analysis, and we are already looking forward to backtesting additional strategies with QuantConnect’s engine…


Are you looking for more strategies to read about? Check http://quantpedia.com/Screener

Do you want to see performance of trading systems we described? Check http://quantpedia.com/Chart/Performance

Do you want to know more about us? Check http://quantpedia.com/Home/About


Follow us on:

Facebook: https://www.facebook.com/quantpedia/

Twitter: https://twitter.com/quantpedia

Continue reading

A Very Influential Paper About Tether-Bitcoin Relationship (Manipulation?)

19.July 2018

Our recommended read to all parties interested in cryptocurrencies …

Authors: Griffin, Schams

Title: Is Bitcoin Really Un-Tethered?

Link: https://papers.ssrn.com/sol3/papers.cfm?abstract_id=3195066

Abstract:

This paper investigates whether Tether, a digital currency pegged to U.S. dollars, influences Bitcoin and other cryptocurrency prices during the recent boom. Using algorithms to analyze the blockchain data, we find that purchases with Tether are timed following market downturns and result in sizable increases in Bitcoin prices. Less than 1% of hours with such heavy Tether transactions are associated with 50% of the meteoric rise in Bitcoin and 64% of other top cryptocurrencies. The flow clusters below round prices, induces asymmetric auto-correlations in Bitcoin, and suggests incomplete Tether backing before month-ends. These patterns cannot be explained by investor demand proxies but are most consistent with the supply-based hypothesis where Tether is used to provide price support and manipulate cryptocurrency prices.

Notable quotations from the academic research paper:

"Our study examines the interaction between the largest cryptocurrency, Bitcoin, other major cryptocurrencies, and Tether, a cryptocurrency that accounts for more transaction volume than U.S. dollars. Tether is a cryptocurrency purportedly backed by U.S. dollar reserves and allows for dollar-like transactions without a banking connection, which many crypto-exchanges have difficulty obtaining or keeping. Although some in the blogosphere and press have expressed skepticism regarding the U.S. dollar reserves backing Tether, the cryptocurrency exchanges have largely rejected such concerns and widely use Tether in transactions.

In this paper, to shed light on the driving forces behind the recent boom of cryptocurrency markets, we focus on variants of two main alternative hypotheses for Tether: whether Tether is ’pulled’ (demand-driven), or ’pushed’ (supply-driven).

First, if Tether is ’pulled’ or demanded by investors who own fiat currency, the issuance of Tether facilitates the demand of these investors who value the flexibility of a digital currency and yet the stability of the dollar ’peg’. The demand for Tether could also arise because of its practicality for engaging in cross-exchange pricing arbitrage.

Alternatively, if Tether is ’pushed’ on market participants, Bitfinex supplies Tether regardless of the demand from investors with fiat currency to purchase Bitcoin and other cryptocurrencies. The acquired Bitcoins can then gradually be converted into dollars. In this setting, the Tether creators have several potential motives. First, if the Tether founders, like most early cryptocurrency adopters and exchanges, are long on Bitcoin, they have a large incentive to create an artificial demand for Bitcoin and other cryptocurrencies by ’printing’ Tether. Similar to the inflationary effect of printing additional money, this can push cryptocurrency prices up. Second, the coordinated supply of Tether creates an opportunity to manipulate cryptocurrencies. When prices are falling, the Tether creators can convert their Tether into Bitcoin in a way that pushes Bitcoin up and then sell some Bitcoin back into dollars to replenish Tether reserves as Bitcoin price rises. Finally, if cryptocurrency prices crash, Tether creators essentially have a put option to default on redeeming Tether, or to potentially experience a ’hack’ where Tether or related dollars disappear. Both the ’pushed’ and ’pulled’ alternatives have different testable implications for flows and cryptocurrency returns that we can take to the powerful blockchain data.

We begin our exercise by collecting and analyzing both the Tether and Bitcoin Blockchain data through a series of algorithms we implement to reduce the complexity of analyzing the blockchain. Tether is created, moved to Bitfinex, and then slowly moved out to other crypto-exchanges, mainly Poloniex and Bittrex. Interestingly, almost no Tether returns to the Tether issuer to be redeemed, and the major exchange where Tether can be exchanged for USD, Kraken, accounts for only a small proportion of transactions.

We then examine the flow of coins identified above to understand whether Tether is pushed or pulled, and examine the effect of Tether, if any, on Bitcoin prices. First, following periods of negative Bitcoin return, Tether flows to other exchanges are used to purchase Bitcoin. Second, these flows seem to have a strong effect on future Bitcoin prices. They are present only after periods of negative returns and periods following the printing of Tether, that is, when there is likely an oversupply of Tether in the system. A placebo test finds no evidence of Bitcoin price movements following large flows of Bitcoin from Poloniex and Bittrex to major exchanges other than Bitfinex. This phenomenon strongly suggests that the price effect is driven by Tether issuances.

To illustrate the potential magnitude and predictive effect of Tether issuances on Bitcoin prices, we focus on the hours with the largest lagged combined Bitcoin and Tether flows on the two blockchains. These 87 hours have large negative returns before the flows but are followed by large return reversals. These 87 events account for less than 1% of our time series (over the period from the beginning of March 2017 to the end of March 2018), yet are associated with 50% of Bitcoin’s compounded return, and 64% of the returns on six other large cryptocurrencies (Dash, Ethereum Classic, Ethereum, Litecoin, Monero, and Zcash).

Consistent with Tether being used to buy Bitcoin when prices drop, we find a statistically and economically strong reversal in Bitcoin prices, but only following negative returns. The Bitcoin reversal did not exist before Tether was prevalent in the market and disappears during the period when Tether stops being printed.

Bitcoin reversal

The results are consistent with the Tether issuers pushing out Tether to stabilize the price of Bitcoin, but we investigate these issues further. Investors hoping to stabilize and drive up the price might concentrate on certain price thresholds as an anchor or price floor. This follows the idea that if investors can demonstrate a price floor, then they can induce other traders to purchase. Interestingly, Bitcoin purchases by Bitfinex strongly increase just below multiples of 500. This pattern is only present in periods following printing of Tether and not observed by other exchanges. To address causality, we use the discontinuity in Tether flow at the round threshold cutoffs as an instrument to measure the effect of Tether on Bitcoin prices. The instrumental regression results are even stronger, indicating that Tether flows are causing the positive return.

If Tether is pushed out to other crypto exchanges rather than demanded by investors with dollars in hand, Tether may not be fully backed by dollars when issued. However, if the issuers wished to post monthly bank statements to shore up dollar reserves and appear fully backed, this would necessitate the liquidation of the purchased Bitcoins at the end-of-the-month (EOM). Interestingly, we find a significant negative EOM abnormal return of 6% in the months with strong Tether issuance. The EOM Bitcoin returns are highly correlated with the magnitude of Tether issuance, and no abnormal returns are observed in months when Tether is not issued.

EOM bitcoin

Our results are consistent with Tether being pushed out onto the market and not primarily driven by investors’ demand, but we nevertheless further examine two direct implications of the ’pulled’ hypotheses. In particular, we examine if the flows of Tether bear much relation to a proxy for its demand from investors, the premium for Tether relative to the U.S. Dollar exchange rate. We find little evidence to support this hypothesis. Another related alternative is that the crossexchange arbitrage to eliminate pricing discrepancies across exchanges is the primary driver of the Tether flow, but this hypothesis is not supported by the data. Although we find little support for demand-based proxies, we hypothesize that there are some sources for legitimate demand for Tether, however, those are not the ones that dominate the flow patterns observed in the data.

"


Are you looking for more strategies to read about? Check http://quantpedia.com/Screener

Do you want to see performance of trading systems we described? Check http://quantpedia.com/Chart/Performance

Do you want to know more about us? Check http://quantpedia.com/Home/About


Follow us on:

Facebook: https://www.facebook.com/quantpedia/

Twitter: https://twitter.com/quantpedia

Continue reading

Do Hedge Funds Ride Market Irrationality or Bet Against It ?

14.May 2018

A nice peak into the hedge funds industry kitchen. At the end, it is an additional evidence that a lot of hedge funds are trend-followers. And the main reason is that they are more successful because of it :

Authors: Liang, Zhang

Title: Do Hedge Funds Ride Market Irrationality?

Link: https://papers.ssrn.com/sol3/papers.cfm?abstract_id=3018483

Abstract:

We document significant evidence that hedge funds temporarily ride rather than attack high market irrationality but neither ride irrationality in the long run nor ride low irrationality. Hedge funds actively ride market irrationality during the formation period of the tech bubble in 2000 but not during the formation period of the housing bubble in 2007. Irrationality-riding funds outperform irrationality-attacking funds by 4.4% per year on a risk-adjusted basis. This outperformance is attributed to irrationality-riding during high irrationality periods-the formation period of the tech-bubble, and the bursting period of the housing bubble. The adoption of irrationality riding strategy is related to manager skill as well as investment styles. Our results are consistent with the behavioral theories that sophisticated investors ride rather than attack unsophisticated investors’ strong misperception. Finally, we do not find that mutual fund managers have the irrationality riding ability.

Notable quotations from the academic research paper:

"The conventional efficient market hypothesis (e.g., Freidman, 1953; Fama, 1965; Fama and French, 1996; Ross, 2001) suggests that rational investors attack market irrationality by conducting arbitrage trades to correct mispricing quickly and profit from their attacking strategy.

In contrast, behavioral studies (e.g., Delong, Shleifer, Summers and Waldman, 1990b; Abreu and Brunnermeier, 2002, 2003; Dumas, Kurshev and Uppal, 2009; Mendel and Shleifer, 2012) claim that rational investors choose to temporarily ride rather than attack noise traders’ high irrationality because the corresponding arbitrage may not be implementable. More interestingly, the behavior theory predicts that riding funds outperforms attacking funds, which is opposite to the conventional efficient market hypothesis theory.

This goal of this study is to distinguish the above two opposing views by empirically testing whether hedge funds, as rational investors, ride noise traders’ high irrationality in short run. Using a large sample of 5,617 equity-oriented hedge funds from the Lipper TASS database over the period from January 1994 to December 2013, we examine whether hedge fund managers ride or attack noise traders’ irrationality, by comparing the percentage of irrationality-riding funds with the portion of irrationality-attacking funds.

Following convention in the noise trading literature, we choose the noise trader sentiment index approximated by the Index of Consumer Sentiment from the University of Michigan as our base proxy for market-wide irrationality.2 We measure irrationality-riding via the timing coefficient in the conventional market timing models. Both the efficient market hypothesis and behavioral theory imply that hedge funds riding market irrationality should have significantly positive coefficients on the interaction term of the market index and the sentiment index, while funds that attack irrationality should have negative coefficients to offset the effect of irrationality on stock prices.

Out of the entire sample, about 20% of hedge fund managers have t-statistics of the riding coefficients equal to or greater than 1.65. The portion of hedge funds with a t-statistic equal to or lower than -1.65 is only 4.6%. These facts suggest that hedge fund managers do not attack, but ride noise traders’ irrationality.

This distribution pattern of the t-statistic significantly varies across investment styles. For example, 62.5% of multi-strategy funds and 35% of global macro funds adopt irrationality-riding strategy but the fraction of irrationality-riding funds among equity market neutral, convertible arbitrage or event driven funds is trivial. Moreover, the fraction of hedge funds with a t-statistic of riding coefficient equal to or greater than 1.65 is 31.4% during the high irrationality periods and is reduced to 17.0% during the lower irrationality periods. This fraction is 32.4% during normal time and 14.4% during the period of two financial crises, including the tech bubble crisis from March 2000 to December 2002 and the subprime crisis from June 2007 to December 2009. Hedge funds actively ride market irrationality during the tech bubble formation period from January 2000 to February 2000, but not during the housing bubble formation period from January 2005 to May 2007. Hedge fund managers do not show meaningful propensity to ride market irrationality in the long run either. The proportion of funds that choose to ride the 12-month leading market irrationality is smaller than the proportion that chooses to attack.

Further, we investigate whether hedge funds’ irrationality-riding choice is attributed to randomness or skill. In sum, our empirical results are consistent with the behavioral theory but not with the efficient market theory. We conclude that hedge fund managers choose to ride high market irrationality in the short run but to attack it in the long run.

Given the fact that market irrationality-riding is generally adopted by hedge funds, we examine whether this strategy is economically significant by comparing the performance of irrationality-riding funds with irrationality-attacking funds in subsequent periods.

The performance difference between the riding and attacking funds in the subsequent periods is consistent with the behavioral predictions but against the predictions of the efficient market hypothesis. The Fung and Hsieh (2004) seven-factor alpha delivered by the riding portfolio is at least 0.31 % per month, or equivalently 3.7% per year, significantly higher than that of the attacking portfolio over the subsequent one to twelve months. The risk-adjusted outperformance of the riding funds relative to the attacking funds in next one month is 0.49% (t-stat=12.02) during the high irrationality periods and -0.03% (t-stat=-0.90) during the low irrationality periods."


Are you looking for more strategies to read about? Check http://quantpedia.com/Screener

Do you want to see performance of trading systems we described? Check http://quantpedia.com/Chart/Performance

Do you want to know more about us? Check http://quantpedia.com/Home/About


Follow us on:

Facebook: https://www.facebook.com/quantpedia/

Twitter: https://twitter.com/quantpedia


Continue reading

Price Overreactions in the Cryptocurrency Market

14.February 2018

Once again, is cryptocurrency market efficient? Or can we find simple trading strategies based on price overreactions? :

Authors: Caporale, Plastun

Title: Price Overreactions in the Cryptocurrency Market

Link: https://papers.ssrn.com/sol3/papers.cfm?abstract_id=3088472

Abstract:

This paper examines price overreactions in the case of the following cryptocurrencies: BitCoin, LiteCoin, Ripple and Dash. A number of parametric (t-test, ANOVA, regression analysis with dummy variables) and non-parametric (Mann–Whitney U test) tests confirm the presence of price patterns after overreactions: the next-day price changes in both directions are bigger  than after “normal” days. A trading robot approach is then used to establish whether these statistical anomalies can be exploited to generate profits. The results suggest that a strategy based on counter-movements after overreactions is not profitable, whilst one based on inertia appears to be profitable but produces outcomes not statistically different from the random ones. Therefore the overreactions detected in the cryptocurrency market do not give rise to exploitable profit opportunities (possibly because of transaction costs) and cannot be seen as evidence against the Efficient Market Hypothesis (EMH).

Notable quotations from the academic research paper:

"Despite a significant number of studies on market overreactions none of them has focused on the cryptocurrency market, which is the most volatile among financial markets: the average daily price amplitude in this market is more than 10 times higher than in FOREX, 7 times higher than in stock market and more than 5 times higher than in the commodity markets. This feature (combined with the fact that it is a very young market) makes it particularly interesting to examine for possible overreactions.

This paper provides new evidence on the overreaction anomaly in the cryptocurrency market by testing the following two hypotheses: after one-day abnormal price movements (overreactions), on the next day abnormal price (i) counter-movements or (ii) momentum movements are observed. For this purpose, a number of statistical tests (both parametric and non-parametric) are carried out. A trading robot approach is then used to investigate whether any detected anomalies generate exploitable profit opportunities. The analysis is carried out for four different cryptocurrencies (BitCoin, LiteCoin, Ripple and Dash).

Empirical Results: analysis confirms the presence of a statistical anomaly in price dynamics in the cryptocurrency market after overreaction days price changes in both directions (in the direction of overreaction and counter movement) are bigger than after normal days.

Next we test whether these anomalies can be exploited to make abnormal profits by using a trading robot approach and considering 2 trading strategies. Strategy 1 is based on the standard overreaction anomaly: there are abnormal counter-reactions after the overreaction day. The trading algorithm in this case is specified as follows: the cryptocurrency is sold (bought) on the open price of the day after the overreaction if an abnormal price increase
(decrease) has occurred. The open position is closed at the end of the day when it was opened. Strategy 2 is based on the momentum effect, the so-called “inertia anomaly”: there are abnormal price movements in the direction of the overreaction on the following  day. The trading algorithm is specified as follows: after the overreaction day the cryptocurrency is sold (bought) on the open price of the day after the overreaction if an abnormal price decrease (increase) has occurred. Again, an open position is closed at the end of the day when it was opened.

BitCoin prices are used for the analysis (data availability motivated this choice) for the years 2015, 2016, 2017 in turn and then for the whole period 2015-2017.

As can be seen, the results of Strategy 1 are rather stable and in general imply a lack of exploitable profit opportunities from trading based on counter-movements after overreactions in the cryptocurrency market. This applies to all periods. The t-test statistics indicate that the   results are not significantly different from the random ones (see Appendix F for details); indirect evidence for this is also provided by the number of profitable trades, which is close to 50%. By contrast, Strategy 2 generates profits in each individual year as well as the full sample, but the results are not significantly different from the random ones (as implied by the t-test statistics). The number of profitable trades is close to 50%. Overall, trading based on the “inertia” anomaly cannot be considered profitable."


Are you looking for more strategies to read about? Check http://quantpedia.com/Screener

Do you want to see performance of trading systems we described? Check http://quantpedia.com/Chart/Performance

Do you want to know more about us? Check http://quantpedia.com/Home/About

Continue reading

Subscribe for Newsletter

Be first to know, when we publish new content


    logo
    The Encyclopedia of Quantitative Trading Strategies

    Log in