Better Small Cap Premium

14.November 2017

A new financial research paper related to:

#25 – Small Capitalization Stocks Premium

Authors: Stefano, Serie, Simon, Lemperiere, Bouchaud

Title: The 'Size Premium' in Equity Markets: Where Is the Risk?

Link: https://papers.ssrn.com/sol3/papers.cfm?abstract_id=3018454

Abstract:

We find that when measured in terms of dollar-turnover, and once beta-neutralised and Low-Vol neutralised, the Size Effect is alive and well. With a long term t-stat of 5.1, the “Cold-Minus-Hot” (CMH) anomaly is certainly not less significant than other well-known factors such as Value or Quality. As compared to market-cap based SMB, CMH portfolios are much less anti-correlated to the Low-Vol anomaly. In contrast with standard risk premia, size-based portfolios are found to be virtually unskewed. In fact, the extreme risk of these portfolios is dominated by the large cap leg; small caps actually have a positive (rather than negative) skewness. The only argument that favours a risk premium interpretation at the individual stock level is that the extreme drawdowns are more frequent for small cap/turnover stocks, even after accounting for volatility. This idiosyncratic risk is however clearly diversifiable.

Notable quotations from the academic research paper:

"One of the best known – and perhaps most controversial – effects in the market folklore is the so-called “size premium”, which states that small-cap stocks are on average undervalued and outperform large-caps. But while still highly popular among equity managers, strong doubts about the very existence of a size premium have been expressed in a number of scientific publications.

Here we want to advocate another, complementary picture. We argue that market capitalisation is not an optimal indicator of an otherwise genuine “size” effect. Indeed, the dependence of a stock “beta” on market capitalisation is non-monotonic, which induces spurious biases in a (market neutral) portfolio construction. The resulting SMB portfolios have a strong short Low-Vol exposure.

We propose instead the average daily volume (ADV) of transaction (in dollars) as an alternative indicator of size, and show that the above mentioned biases are substantially reduced. The choice of ADV is further motivated by two independent arguments, often put forth in the literature. One is that the size effect might in fact be a liquidity risk premium, i.e., “Cold” stocks, that are more difficult to liquidate, are traded at a discount. The other is that heavily traded, “Hot” stocks are scrutinized by a larger number of market participants, therefore reducing pricing errors.

Although these arguments sound reasonable, we will show below that they fail to capture the mechanism underlying the profitability of Cold-Minus-Hot (CMH) portfolios. Perhaps surprisingly, standard skewness measures do not conform to the idea of that the size effect is a risk premium. In fact, the single name skewness of small cap/small ADV stocks is positive, and declines to zero as the market cap/ADV increases. At the portfolio level, small cap/ADV stocks do not contribute to skewness either. In fact, the SMB portfolio is only weakly negatively skewed, whereas the CMH portfolio is not skewed at all; furthermore, large gains/losses at the portfolio level mostly come from the short leg (corresponding to large cap/ADV stocks). All these results suggest that “prudence” (i.e. aversion for negative skewness and appetite for positive skewness) should favour small cap/ADV stocks, in contradiction with the idea that SMB or CMH are risk premia strategies.

Interestingly, however, higher moments of the return distribution, such as the kurtosis or the downside tail probability, show a clear decreasing pattern as a function of market cap or ADV. In other words, extreme in both directions are more common for small stocks, even after factoring out volatility. Even if, quite unexpectedly, large upside events are more likely than large downside events for small stocks, “safety first” considerations might be enough to deter market participants from investing in these stocks. This scenario would allow one to think of the size anomaly as a risk premium – albeit a rather non conventional one."


Are you looking for more strategies to read about? Check http://quantpedia.com/Screener

Do you want to see performance of trading systems we described? Check http://quantpedia.com/Chart/Performance

Do you want to know more about us? Check http://quantpedia.com/Home/About

Continue reading

Financialization of Crude Oil Market

26.July 2017

Financial variables have become the main driving factors explaining the variation in crude oil returns:

Authors: Adams, Kartsakli

Title: Has Crude Oil Become a Financial Asset? Evidence from Ten Years of Financialization

Link: https://papers.ssrn.com/sol3/papers.cfm?abstract_id=2999717

Abstract:

The financialization of crude oil markets over the last decade has changed the behavior of oil prices in fundamental ways. In this paper, we uncover the gradual transformation of crude oil from a physical to a financial asset. Although economic demand and supply factors continue to play an important role, recent indicators associated with financialization have emerged since 2008. We show that financial variables have become the main driving factors explaining the variation in crude oil returns and volatility today. Our findings have important implications for portfolio analysis and for the effectiveness of hedging in crude oil markets.

Notable quotations from the academic research paper:

"We decompose the total variation of crude oil returns and volatility into three distinctive parts: One part that can be explained by economic fundamental factors, one part that can be explained by financialization variables, and a third which consists of the unexplained variation. While decomposing the returns provides information concerning the main drivers of crude oil as an asset, the volatility decomposition reveals the main factors of risk transmission. We show that the relative importance of economic and financial variables changes over time. In particular, the relative importance of financial variables has changed in such a way that crude oil is now closer to a financial asset than to a real physical asset.

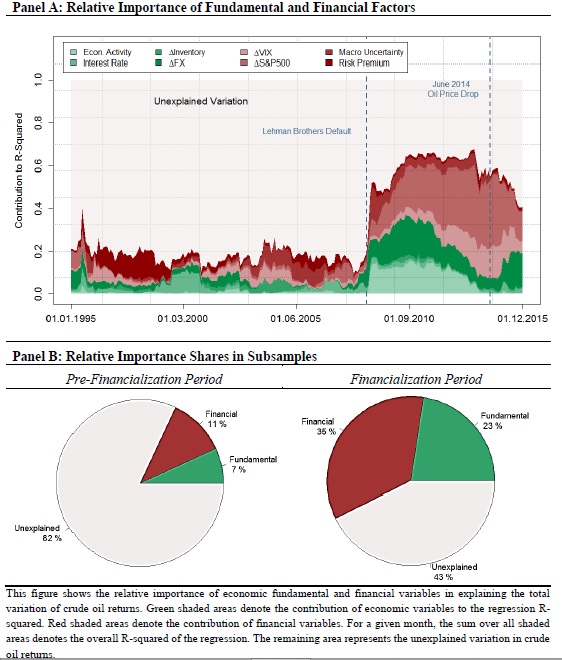
Panel A of Figure 4 shows the decomposition of the total variation in crude oil returns. The fraction of the total variation that can be explained by movements in economic variables is indicated by green shaded areas, the percentage that can be explained by financial variables is indicated by the red shaded areas. The remaining variation is unexplained. The large share of unexplained variation may be due to omitted factors such as geopolitical changes, synchronized OPEC oil production, and disrupting weather events. At a given point in time, the sum over all green and red shaded areas represents the R-squared from a regression of monthly crude oil returns on our set of explanatory variables. To obtain time variation, the regression is moved forward in a 5-year rolling window (60 monthly observations). Two observations follow from Figure 4:

During the pre-financialization period, the contemporaneous variation in our eight regressors explains only a small percentage of the total variation in crude oil returns. After the default of Lehman Brothers, the situation changes dramatically. The same set of regressors now explain almost 60% of the return variation. Among the fundamental variables, economic activity and the change in the dollar exchange rate explain 8% and 12% respectively.

The main drivers behind the variation in oil returns are however the financial variables. In particular, the change in the VIX and the S&P 500 returns are responsible for 29% of the variation.

To illustrate this point, the average fraction explained by each set of variables is shown in Panel B of Figure 4. Since the beginning of the financialization period, the financial variables dominate the economic fundamental variables by a significant amount. Traditional fundamental variables have become relatively less important for predicting crude oil returns while recent financial variables can now predict a large share of the return variation. From this finding we conclude that the behavior of crude oil has become more similar to that of financial assets like equities rather than traditional economic demand and supply drivers.

Table

Financial variables can only explain 11% of the total variation in crude oil returns in the years prior to financialization, the impact grows to 35%, becoming the main drivers behind oil price movements. We estimate an even stronger effect on crude oil volatility where the impact of financial variables grows from 19% in the pre-financialization period to 53% since the failure of Lehman Brothers. Our empirical results indicate that crude oil markets underwent significant changes over the last years. These changes were sufficiently large to transform the very nature of crude oil, away from a physical real asset towards a variable that shows a behavior that is comparable to stocks, bonds, and other financial assets."


Are you looking for more strategies to read about? Check http://quantpedia.com/Screener

Do you want to see performance of trading systems we described? Check http://quantpedia.com/Chart/Performance

Do you want to know more about us? Check http://quantpedia.com/Home/About
Continue reading

How to Improve Shiller’s CAPE Ratio

19.July 2017

An interesting idea to create a CAPE Ratio with a better predictability:

Authors: Davis, Aliaga-Diaz, Ahluwalia, Tolani

Title: Improving U.S. Stock Return Forecasts: A 'Fair-Value' Cape Approach

Link: https://papers.ssrn.com/sol3/papers.cfm?abstract_id=2983860

Abstract:

The accuracy of U.S. stock return forecasts based on the cyclically-adjusted P/E (CAPE) ratio has deteriorated since 1985. The issue is not the CAPE ratio, but CAPE regressions that assume it reverts mechanically to its long-run average. Our approach conditions mean reversion in the CAPE ratio on real (not nominal) bond yields, reducing out-of-sample forecast errors by as much as 50%. At present, low real bond yields imply low real earnings yields and an above-average “fair-value” CAPE ratio. Nevertheless, with Shiller’s CAPE ratio now well above its fair value, our model predicts muted U.S. stock returns over the next decade. We believe that our framework should be adopted by the investment profession when forecasting stock returns for strategic asset allocation. 

Notable quotations from the academic research paper:

"Valuation metrics such as price-earnings ratios are widely followed by the investment community because they are believed to predict future long-term stock returns. Arguably the most popular is Robert Shiller’s cyclically-adjusted P/E ratio (or CAPE) which is currently above its long-run average. However, the out-of-sample forecast accuracy of stock forecasts produced by CAPE ratios has become increasingly poor. In this paper we have shown why and offer a solution to offer a more robust approach to produce long-run stock return forecasts.

The problem is not with the CAPE ratio, but with CAPE regressions. We show that a common industry approach of forecasting long-run stock returns can produce large errors in forecasted returns due to both estimation bias and its strict assumption that the CAPE ratio will revert over time to its long-run (and constant) mean. Although far from perfect, our model’s out-of-sample forecasts for ten-year-ahead U.S. stock returns since 1960 are roughly 40-50% more accurate than conventional methods. Real-time forecast differences in 10-year-ahead stock returns are statistically significant, and have grown to exceed three percentage points after 1985 given the secular decline in real bond yields. In our model, lower real bond yields imply higher equilibrium CAPE ratios. This framework would appear to explain both elevated CAPE ratios and robust stock returns over the past two decades.

Figure 8 shows the actual real-time forecast of our two-step model for U.S. stocks. Our fair-value CAPE approach tracks the actual rolling 10-year-ahead U.S. stock returns fairly well, declining throughout the 2000s and anticipating a strong rebound immediately following the global financial crisis in 2009. Traditional CAPE regressions are also highly correlated with future returns, yet they consistently project lower 10-year-ahead stock returns than what has been actually realized by investors over our sample period.

Fair value CAPE

As of June 2017, our model projects a guarded, lower-than-historical return on U.S. stocks of approximately 4.9% over the coming decade."


Are you looking for more strategies to read about? Check http://quantpedia.com/Screener

Do you want to see performance of trading systems we described? Check http://quantpedia.com/Chart/Performance

Do you want to know more about us? Check http://quantpedia.com/Home/About

Continue reading

Is Equity Premium Predictable?

14.July 2017

It is very hard to do a successful un-biased out-of-sample prediction of equity premium:

Authors: Bartsch, Dichtl, Drobetz, Neuhierl

Title: Data Snooping in Equity Premium Prediction

Link: https://papers.ssrn.com/sol3/papers.cfm?abstract_id=2972011

Abstract:

We study the performance of a comprehensive set of equity premium forecasting strategies that have been shown to outperform the historical mean out-of-sample when tested in isolation. Using a multiple testing framework, we find that previous evidence on out-of-sample predictability is primarily due to data snooping. We are not able to identify any forecasting strategy that produces robust and statistically significant economic gains after controlling for data snooping biases and transaction costs. By focusing on the application of equity premium prediction, our findings support Harvey’s (2017) more general concern that many of the published results in financial economics will fail to hold up.

Notable quotations from the academic research paper:

"Does equity premium prediction pay off? While the in-sample predictability of the equity premium seems largely undisputed, most investors are ultimately interested in whether forecasting strategies can deliver reliable out-of-sample gains. Recognizing the controversial debate regarding the out-of-sample performance of established stock return prediction models, Spiegel (2008) poses a challenging question: “Can our empirical models accurately forecast the equity premium any better than the historical mean?”

One challenge in answering the question of out-of-sample predictability is that almost all forecasting strategies are tested on a single data set. When many models are evaluated individually, some are bound to show superior performance by chance alone, even though they are not. This bias in statistical inference is usually referred to as ‘data snooping’. Without properly adjusting for this bias in a multiple testing set-up, we might commit a type I error, i.e., falsely assessing a forecasting strategy as being superior when it is not. In fact, Harvey, Liu, and Zhu (2016) note that equity premium prediction offers an ideal setting to employ multiple testing methods.

To the best of our knowledge, our study is the first to jointly examine the out-of-sample performance of a comprehensive set of equity premium forecasting strategies relative to the historical mean, while accounting for the data snooping bias. We construct a comprehensive set of 100 forecasting strategies that are based on both univariate predictive regressions and advanced forecasting models, including strategies that adopt diffusion indices or combination forecast approaches, apply economic restrictions on the forecasts, predict disaggregated stock market returns, or model economic regime shifts.

We use these forecasting strategies to predict the monthly U.S. equity premium out-of-sample based on the most recent 180 months and track their out-of-sample perfor-mance for the subsequent month over the evaluation period from January 1966 to December 2015. We aim to answer Spiegel’s (2008) question, i.e., whether there are forecasting strategies that provide a significantly higher performance than the prevailing mean model. As performance measures, we use the mean squared forecast error and absolute as well as risk-adjusted excess returns.

Why is data snooping a concern in our analysis? Suppose these 100 models are mutually independent, and we apply a t-test to each model with the significance level of 5%. The probability of falsely rejecting at least one correct null hypothesis is 1 – (1 – 5%)100 ≈ 0.994. Therefore, it is very likely that an individual test may incorrectly suggest an inferior model to be a significant one. This simple example emphasizes the importance of an appropriate method that can control such data-snooping bias and avoids spurious inference when many models are examined together.

Our results show that many forecasting strategies outperform the historical mean when tested individually. However, once we control for data snooping, we find that no forecasting strategy can outperform the historical mean in terms of mean squared forecast errors. With respect to return-based performance measures, we find marginal evidence for statistically significant economic gains at least on a risk-adjusted excess return basis when using the equity premium forecasts in a traditional mean-variance asset allocation, even after controlling for data snooping bias. In contrast, the benefits for a pure market timing investor are limited. Taken together, our findings strengthen the results of Goyal and Welch (2008) that the out-of-sample predictability of the equity premium is questionable."


Are you looking for more strategies to read about? Check http://quantpedia.com/Screener

Do you want to see performance of trading systems we described? Check http://quantpedia.com/Chart/Performance

Do you want to know more about us? Check http://quantpedia.com/Home/About

Continue reading

Invitation to webinar – Classification of Quantitative Trading Strategies

3.July 2017

Dear readers,

We at Quantpedia are pleased to invite you to a our new webinar Classification of Quantitative Trading Strategies prepared in cooperation with our friends from QuantInsti. Webinar is scheduled on Tuesday 11th July, 9:30 AM EST | 7:00 PM IST | 9:30 PM SGT and will cover a range of topics related to applicability of financial academic research in a real trading.

Session Outline

    – Introduction to ‘Quantpedia & QuantInsti™’
    – Overview of research in a field of quantitative trading
    – Taxonomy of quantitative trading strategies
    – Where to look for unique alpha
    – Examples of lesser-known trading strategies
    – Common issues in quant research
    – Questions and Answers

Register now !

Continue reading

An Analysis of 52-Weeks High Effect in Indian Stocks

13.May 2017

We are really happy to see that guys from QuantInsti did a new independent analysis of a strategy we have in our database. An article is written by Milind Paradkar and is focused on 52-Weeks High Effect in Stocks (Strategy #18) using Indian stocks as an investment universe:

https://www.quantinsti.com/blog/trading-strategy-52-weeks-high-effect-in-stocks/

QuantInsti™ is one of the pioneer algorithmic trading research and training institutes across the globe. With its educational initiatives, QuantInsti™ is preparing financial market professionals for the contemporary field of algorithmic and quantitative trading. They offer a really well-prepared professional training course EPAT™ (Executive Programme in Algorithmic Trading) which is Asia's first algorithmic trading education program. This comprehensive course exposes its participants to various strategy paradigms and enables them to build an algorithmic trading system. QuantInsti™ also offers Quantra which is an e-learning portal that specializes in short self-paced courses on algorithmic and quantitative Trading. Quantra™ offers an interactive environment which supports 'learning by doing' through guided coding exercises, videos and presentations.

The original academic paper (“Industry Information and the 52-Week High Effect”) has been authored by Xin Hong, Bradford D. Jordan, and Mark H. Liu. They propose a modified rotational momentum strategy which uses a 52-Week High as a predictor of cross-sectional equity performance to select top performing industries.

Milind Paradkar from QuantInsti performed an independent analysis of a resultant strategy during last 3 years (an out of sample period from 2014 until 2017) on Indian stocks. Overall, the performance isn't very stellar and we can say that Indian market hasn't been very generous for this strategy (total performance has been only 17% flat over those 3 years with a Sharpe ratio around 0.4). But we are really glad for this analysis as it offers a valuable look on a strategy on different universe as most trading strategies are usually academically researched only on US equities.

The final OOS equity curve:

Strategy's performance

Thanks for nice analysis Milind…

Continue reading

Subscribe for Newsletter

Be first to know, when we publish new content


    logo
    The Encyclopedia of Quantitative Trading Strategies

    Log in