The Effectivity of Selected Crisis Hedge Strategies
Introduction
During past months we made a set of articles analyzing the performance of equity factors and selected systematic strategies during coronavirus crisis. These articles were short-ranged with data only from the start of the year 2020, which is enough for the purpose of the quick blog posts, but very short-sighted to see the nature of these strategies. Therefore, we expanded the time range by 20 years. For a better understanding of hedge possibilities of these strategies, we have added a comparison to essential safe-haven assets, not only to equities.
In this article, we are analyzing three groups of strategies/assets and their performance during the equity market downturn, which we defined as months with a negative performance of SPY ETF. As usually, strategies are coded in QuantConnect.
First of these three groups contains systematic Crisis Hedge strategies, namely Currency Momentum Factor, Commodity Momentum Factor, Time Series Momentum Effect and Skewness Effect in Commodities. Chosen strategies should perform well at the market downturn (at least the source papers by which the strategies are built state that).
Currency momentum is beside others mentioned in the paper by Grobys, Heinonen and Kolari (2016), which shows its ability to be a hedge for global economic risk. Also, the momentum effect in commodities is a good hedge strategy as it has been shown in the paper by Blitz and Groot (2013), which analyze the risk-adjusted performance of commodity market factors portfolio. The hedging possibilities of time-series momentum effect and skewness effect in commodities are analyzed in the paper from Moskowitz, Ooi and Pedersen (2011), resp. Perez, Frijns, Fuertes and Miffre (2017) which are also the source papers of these strategies. Source paper of these strategies and other mentioned papers designate them to be possibly used as a hedge during the market turmoil, but this claim should be tested by their performance.
Time series in Figure 1 could tell us that the currency momentum is the worst candidate for hedging from mentioned systematic strategies as its performance during the observed period is negative. However, what truly matters are results only during the downturn.
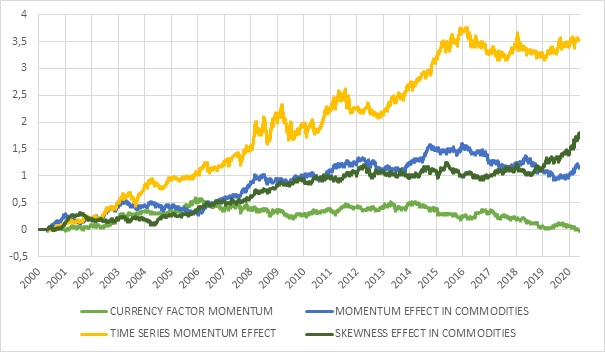
Figure 1 Time series of Systematic crisis hedge strategies
The second group consist of basic equity factor strategies – value, size, reversal, quality, momentum, low volatility and investment. However, not all of these factors could be used as a hedge what Geertsema and Lu (2020) exhibited in their paper, where they studied factors performance during overwhelming period reaching times before the Vietnam War. Which factors can be used as a hedge and how good they are, we will discuss further in the article. From the time series in Figure 2, we can see the wide dispersion of performances during the observed period ranging from -75% to 560%. To build equity factor strategies, we used data from Morningstar.

Figure 2 Time series of Equity factor strategies
The last, third, group contains the safe-haven assets, which we will use to compare the hedging possibilities of chosen systematic strategies in the first two groups. This group contains Gold futures, 10 years US Treasuries futures and USD TWI (trade-weighted) futures.

Figure 3 Time series of safe-haven assets
Building of systematic strategies
How are the systematic strategies built? To save space and not repeat ourselves, we will not repeat trading rules in this article. Readers can review both previous articles where trading rules are specified:
YTD Performance of Crisis Hedge Strategies
YTD Performance of Equity Factors
Hedging effectivity of systematic crisis hedge strategies
For better visualization of strategies performance, we divided the time series into two datasets – 2000-2010 and 2010-2020 (as you can see in Figure 4), because of the different nature of the times before 2010 and after then. The first decade of this century was represented with two big market crashes, and thereafter the performance of the stock market wasn’t much satisfying. The exact opposite was the following decade where there was no stock market crash, and prices soared to new and new highs. At the start of this decade, the coronavirus crisis hit the global economy and so the financial markets, but we won’t be writing further about it as it hasn’t ended yet.
All systematic strategies performed much better throughout the first decade in comparison to the second, which implies that precarious period suits them better than steady growth. In both periods, the Time Series Momentum Effect dominated and also was the best strategy in the average performance in downside months of equity market represented by SPY ETF (tracking S&P 500; available finance.yahoo.com). The only negative performer was the Currency Momentum Factor strategy which was slightly positive in the first decade but turned downwards in the last five years. The two remaining strategies – Commodity Momentum Factor and Skewness Effect in Commodities performed almost equal sufficiently in the first period but diverged in the last year of our observed period when Commodity Momentum Factor ended the second decade with nearly neutral performance, and Skewness Effect in Commodities jumped to 100% gain like Time Series Momentum Effect.

Figure 4 Divided time series of Systematic crisis hedge strategies
The performance of equity factor strategies during equity downside months is in Figure 5. We can see the same story; strategies with the best total performance are also the best hedge. Equities in downside months lost in average 3.6%, all systematic strategies had positive performance (except Currency Momentum Factor, which is surprisingly neutral = -9.4e-05). So, on the average, crisis hedge strategies really worked as a diversification during equity downturns.
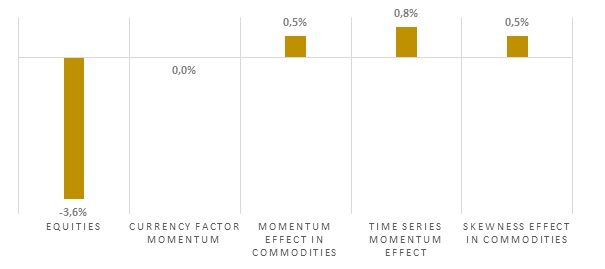
Figure 5 Systematic crisis hedge strategies average performance in downside months
For those who are interested, we also present the downside correlation to equities in Figure 6.

Figure 6 Systematic crisis hedge strategies correlation to equities in downside months
Hedging effectivity of systematic equity factor strategies
As we mentioned earlier, not all of the equity factors could be used as a hedge to equities. Geertsema and Lu (2020) who made similar analysis as we did beside others also with Fama and French factors (2018), shows that historically the value, profitability, investment and momentum factors had better performance in bear markets, although during recent coronavirus crisis only the Momentum and Quality factors were profitable.
During the first decade of our observed period in Figure 7, only the momentum factor wasn’t profitable because of several turnovers during this period where the strategy couldn’t build solid momentum base. On the other hand, the Equity factor strategies that have much better performance in both periods and therefore also overall are Quality and Reversal factor strategies with a return about 600%, resp. 400%. We cannot also omit Size, Low volatility and Value factor strategies. Their performance was stable with moderate growth during both periods (although Investment factor strategy’s performance quite decreased by the end of 2019). A specific case is the Value factor strategy, which gained more than 100% in the trembling times of the first decade, but lost all outperformance and ended negative through the second one.

Figure 7 Divided time series of equity factor strategies
With the average equity performance in downside months at the level of -3.6%, the individual Equity factor strategies presented themselves as interesting hedgers. The worst result was -0.4% for Value and Reversal factor, as you can see in figure 8. All other factors ended with positive average performance in downside months where the leaders were Quality and Momentum factor strategies with average performance 2.1%, resp. 1.6%.

Figure 8 Equity factor strategies average performance in downside months
The Equity factor strategies correlation to equities in downside months validate most of the average performance results. The biggest incoherency is in Size factor strategy, which has a positive correlation with equities but had a positive average performance in downside months and the Reversal factor strategy which has the largest correlation to equities at the level of 26.23% but its average performance was only -0.4% in comparison with equities -3.6%.

Figure 9 Equity factor strategies correlation to equities in downside months
Hedging effectivity of safe-haven assets
We won’t be especially commenting on the safe-haven group because they are quite known, and we are using them mainly to compare chosen Systematic strategies and Equity factor strategies performance. From the time series in Figure 10, we can see that the Gold futures are much more volatile in comparison with US Treasury futures or USD futures but also has the highest growth potential. We can’t say that about the dollar, but it can be at least be used only as a store of value with no growth throughout the two decades.

Figure 10 Divided time series of safe-haven assets
In Figure 11, we can see that the average performance of safe-haven assets was positive – as expected. The leaders are treasury futures (1%), which also had the steadiest growth in this group. The others do not lag much behind the bonds with the gold growth of 0.7% and the dollar growth of 0.6%.

Figure 11 Safe haven assets average performance in downside months
The interesting thing in Figure 12 is that gold futures have a positive correlation to equities in downside months even when they exhibit positive performance. The reason for that may be because, during the largest drops in equities price, the gold’s price is weakening alike as it is used to cover margin calls. However, the drop isn’t as large and tends to recover faster than the equities, so that’s why the positive performance.

Figure 12 Safe haven assets correlation to equities in downside months
Conclusion
This article intended to analyze and test chosen systematic crisis hedge strategies and equity factor strategies during equity market downside months and compare these results with well known safe-haven assets. The systematic strategies should have the ability to be used as a hedge because the source papers of these strategies propose it. In the equity factor strategies group, we just wanted to test these factors if they possess the ability to be used as a hedge during the equity market turmoil.
It seems that we can accept our hypothesis for all tested strategies because all of them performed a way better than equities during negative months. Firstly, let’s check our benchmarks – the average performance of equities in downside months was negative -3.6% and the safe-havens represented by Gold futures, US Treasury futures and USD futures performed positively 0.7%, 1% and 0.6%.
The results of the first group, systematic crisis hedge strategies were around the level of safe-haven assets (except for the currency momentum factor, which disappointed). But even the worst performer ended with neutral average performance (0%) which is still much better than equities -3.6%.
The results for the second group, equity factor strategies, were more heterogeneous with the worst two strategies Value and Reversal factors with an equal performance of -0.4% and the best Quality factor strategy with 2.1% return. Also, the Momentum factor strategy outperformed safe-haven assets with a 1.6% gain.
Overall, we can conclude that there isn’t a scarcity of strategies that could be used as a hedge during equity market crisis.
Authors:
Radovan Vojtko, CEO & Head of Research, Quantpedia
Dominik Cisar, Quant Analyst, Quantpedia
Are you looking for strategies applicable in bear markets? Check Quantpedia’s Bear Market Strategies
Are you looking for more strategies to read about? Sign up for our newsletter or visit our Blog or Screener.
Do you want to learn more about Quantpedia Premium service? Check how Quantpedia works, our mission and Premium pricing offer.
Do you want to learn more about Quantpedia Pro service? Check its description, watch videos, review reporting capabilities and visit our pricing offer.
Do you want algorithmic access to the full Quantpedia database via the API? Subscribe to Quantpedia Pro, ask for an API key, and explore the in/out-of-sample statistics, source academic papers, and code snippets — ideal for quantitative research, systematic trading workflows, and AI model training.
Are you looking for historical data or backtesting platforms? Check our list of Algo Trading Discounts.
Or follow us on:
Facebook Group, Facebook Page, Telegram, Twitter, Linkedin, Medium or Youtube
Share onLinkedInTwitterFacebookRefer to a friend


