Quantpedia in March 2021
Hello all,
The spring is in the air (at least in the northern hemisphere), and we were not sitting idle in the last month. The most interesting development is a series of new reports for Quantpedia Pro that I will describe soon.
But first, let’s recapitulate Quantpedia Premium development. Nine new Quantpedia Premium strategies have been added to our database, and fifteen new related research papers have been included in existing Premium strategies during the last month. Additionally, we have produced 12 new backtests written in QuantConnect code. Our database currently contains over 420 strategies with out-of-sample backtests/codes.
And now, let me present the first new report for Quantpedia Pro. The Factor Cycle report is based on the interesting idea described in the “Momentum Turing Points” research paper written by Garg, Goulding, Harvey and Mazzoleni. Authors use a combination of shorter and longer period momentum signals to define four states of the market – Bull Market (both long and short term momentum are positive), Correction (long term momentum is positive, but short term momentum flipped to negative), Bear Market (both long and short term momentum are negative) and Recovery (long term momentum is negative, but short term momentum flipped to positive). We found this decomposition very useful and decided to build a report that visualizes the current state of nearly 50 most common markets and systematic factor strategies. Additionally, user can also review the current and historical states of factors/markets that are selected in the Portfolio Manager sub-page.

The report is divided into multiple segments; each segment consists of one table and two charts. The picture above shows one segment (dedicated to commodities) of the whole report. The table shows the current state of the selected factors/markets and their past 3- and 12-month performance. “Sinus Wave” charts is a visualization of the current state for each factor/market. And the second chart shows the history of states for each underlying for the last 12 months.
The second new Quantpedia Pro report examines the trends in average correlation in the major segments of financial markets (equity sectors, regions, factors, commodity sectors, factors, major currency pairs and factors, and fixed income sectors and factors). Often, the newspaper articles mention that the average correlation in this or that segment of the financial market is elevated. The new Inter-Market Correlation report shows the current average correlation among individual elements in each segment and its evolution over time. This report allows users to quickly find out which segments of the global financial markets temporarily move in unison (or, on the other hand, have divergent movements).
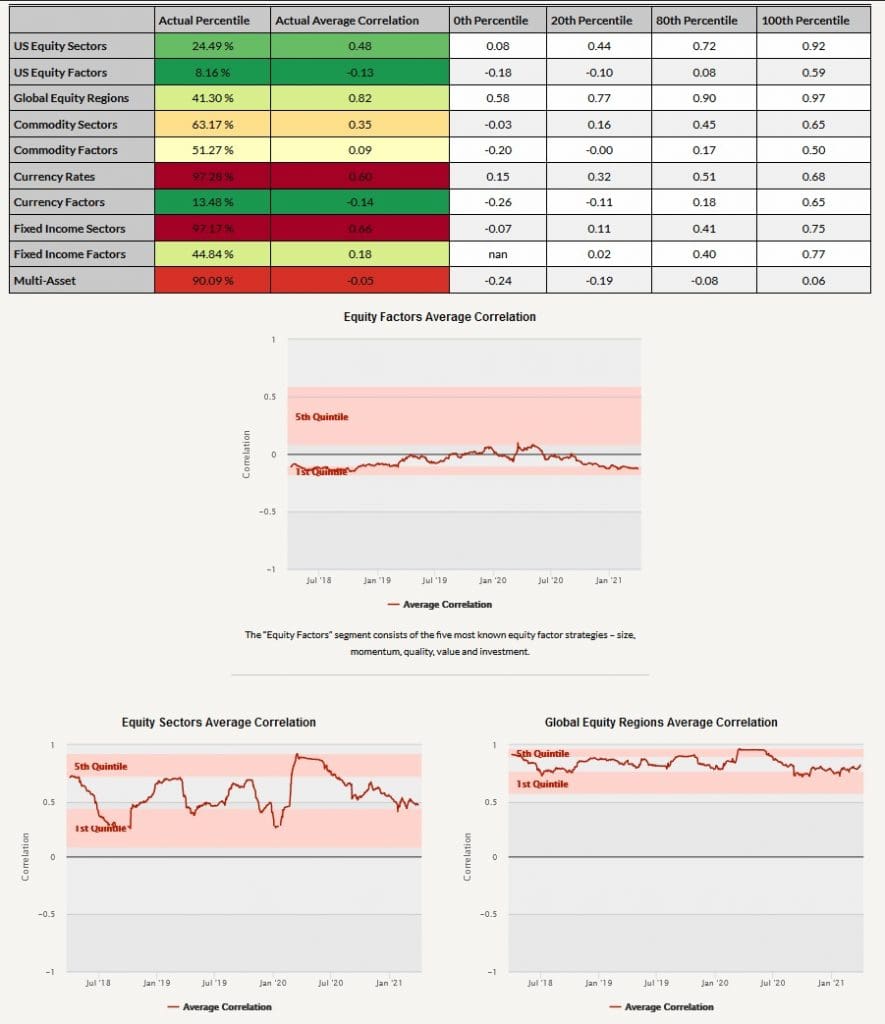
Firstly, the summary table presents what’s the current average correlation between individual elements in each segment, what are the minimum (0th percentile) and maximum (100th percentile) correlations in each segment and what’s the usual range (20th and 80th percentile). Afterwards, each segment is displayed in a chart that shows the evolution of the average correlation over the last three years and the 1st and 5th quintile of historical average correlation (calculated from the whole data history we have available for each segment). The picture above shows the first three segments – equity factors, equity sectors and equity regions.
And finally, four new blog posts that you may find interesting have been published on our Quantpedia blog in the previous month:
An Investigation of R&D Risk Premium Strategies
Author: Marek Lievaj
Title: An Investigation of R&D Risk Premium Strategies
Retail Investment Boom, Robinhood, Passive Investing and Market Inelasticity
Authors: Philippe van der Beck and Coralie Jaunin & Xavier Gabaix and Ralph S. J. Koijen
Titles: The Equity Market Implications of the Retail Investment Boom & In Search of the Origins of Financial Fluctuations: The Inelastic Markets Hypothesis
Does Social Media Sentiment Matter in the Pricing of U.S. Stocks?
Author: Christian Koeppel
Title: Does Social Media Sentiment Matter in the Pricing of U.S. Stocks?
An Introduction to Volatility Targeting
Author: Daniela Hanicova
Title: An Introduction to Volatility Targeting
Stay safe …
Radovan Vojtko
CEO & Head of Research
Are you looking for more strategies to read about? Sign up for our newsletter or visit our Blog or Screener.
Do you want to learn more about Quantpedia Premium service? Check how Quantpedia works, our mission and Premium pricing offer.
Do you want to learn more about Quantpedia Pro service? Check its description, watch videos, review reporting capabilities and visit our pricing offer.
Do you want algorithmic access to the full Quantpedia database via the API? Subscribe to Quantpedia Pro, ask for an API key, and explore the in/out-of-sample statistics, source academic papers, and code snippets — ideal for quantitative research, systematic trading workflows, and AI model training.
Are you looking for historical data or backtesting platforms? Check our list of Algo Trading Discounts.
Or follow us on:
Facebook Group, Facebook Page, Twitter, Linkedin, Medium or Youtube
Share onLinkedInTwitterFacebookRefer to a friend


