Skewness / Lottery Effect in Commodities
We at Quantpedia are continually building a database of ideas for quantitative trading strategies derived out of the academic research papers. Motivated by the recent fall of the S&P500 index at the end of 2018, we have added a new filtering field into our Screener, which you can use to find strategies that can be utilized as a hedge/diversification to equity market risk factor during bear markets. We would like to present one strategy that is profitable itself, but with an added value of negative correlation with the equity market, to be able to perform in the desired way also during the " bad" times.
The strategy we would be talking about can be found in our database under the name #281 – Skewness Effect in Commodities and is built on a research paper written by Fernandez-Perez, Frijns, Fuertes and Miffre – The Skewness of Commodity Futures Returns. Guys at AlphaArchitect have been really generous and they have provided a space for us to write a short article in which we 1) briefly discuss the lottery effect, 2) we discuss the research on this topic in the context of commodities, and 3) we conduct an independent replication effort of the commodity lottery effect identified in academic research.
Authors: Vojtko, Padysak
Title: Skewness Effect in Commodities
Link: https://alphaarchitect.com/2019/05/30/skewness-effect-in-commodities/
Shortly:
"Economies and markets have their seasonalities and cyclicality, where bull markets alternate with bear markets. Bull markets are connected with particularly good performance of the stocks and profiting investors. However on the other hand, during the bear markets, investors tend to lose in the falling equity market. Therefore, during these stressful times, it might be better for practitioners to invest in a portfolio that is negatively correlated with the equity market to gain profit instead of counting loses.
There is strong evidence that investors have a preference for lottery-like assets (the assets that have a relatively small probability of a large payoff or in other words, big skewness). Therefore, it should be profitable to not play the lottery, but rather be “the lottery ticket issuer“ by shorting the commodities with high skewness and going long commodities with low skewness. Additionally, commodities as an asset class are quite distinct from equities and therefore they can often be used as a diversifier to equities.
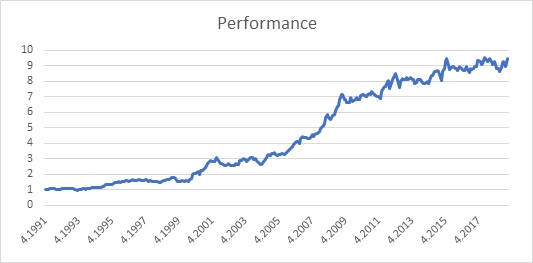
Clearly, the strategy is profitable, a dollar invested in 1991 would result in more than 9 dollars by 2019, which results in a yearly performance of nearly 8,5%. Moreover, the risk of the strategy is relatively low, with the maximal drawdown of around 16 %, which results in a return to a drawdown ratio of slightly more than 0,5.
Our research suggests that the performance of the equity market represented by the S&P500 index is negatively correlated with the performance of the skewness strategy. Therefore, if the equity market performs badly, our strategy should be still profitable.
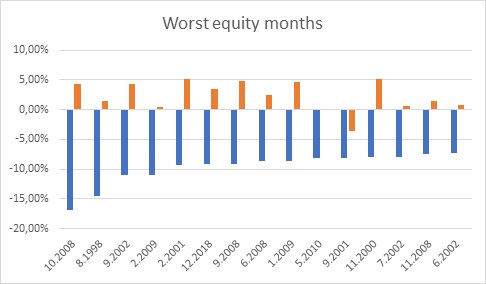
What is more important, if we would look upon the worst months of S&P500 index (blue bars) and compare it with the performance of the strategy (orange bars), we would see the performance of the suggested strategy is at most times positive and therefore the investor would be able to hedge his equity portfolio.
To sum it up, the lottery anomaly in commodities is alive and performs in a desirable way also in the recent period. Moreover, the profitable strategy based on this anomaly could also serve as a hedge against equities and offer a profitable possibility to invest during times when equities are in bear markets.
Authors:
Radovan Vojtko, CEO, Quantpedia.com
Matus Padysak, Analyst, Quantpedia.com
"
Are you looking for more strategies to read about? Check http://quantpedia.com/Screener
Do you want to see the performance of trading systems we described? Check http://quantpedia.com/Chart/Performance
Do you want to know more about us? Check http://quantpedia.com/Home/About
Follow us on:
Facebook: https://www.facebook.com/quantpedia/
Twitter: https://twitter.com/quantpedia
 "
"